HelpDesk
How to Add and Edit Text on Connectors
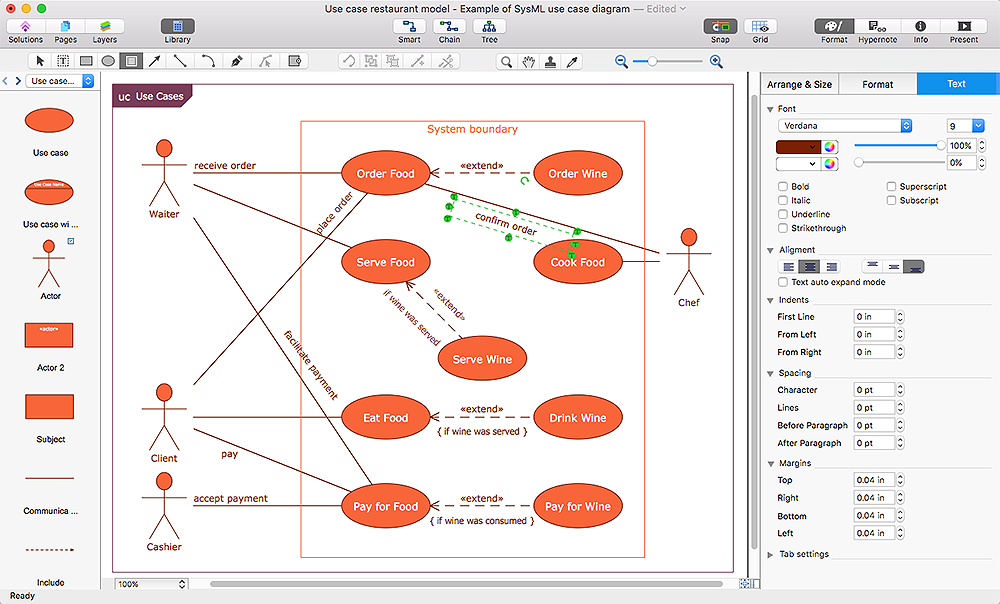
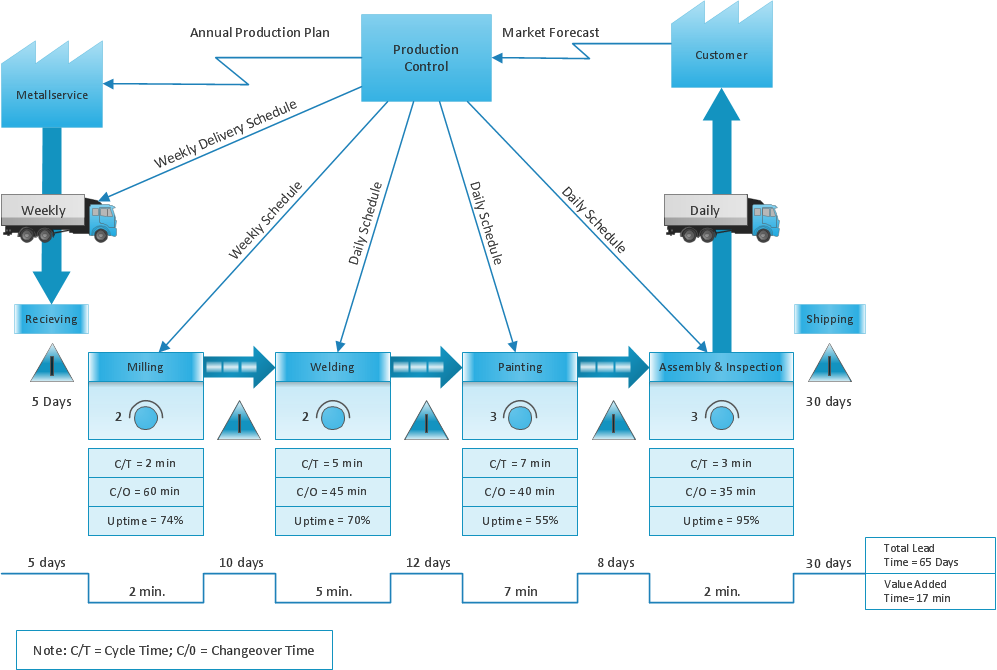
The new ConceptDraw Arrows10 Technology is a powerful diagramming technique that powered the way business drawing created. ConceptDraw PRO gives you some tools for connecting shapes: Direct Connectors, Smart, Arc, Bezier, Curve and Round Connectors.Direct Connectors are direct lines from the point to the point. Smart , Arc, Bezier, Curve and Round Connectors are almost the same as Direct Connectors. However, they automatically move around other objects. You can use Chain, or Tree connection mode for connection of multiple objects with any type of connectors. ConceptDraw PRO allows you to add and move text on a connector the same way that you add and move text on other any object.ConceptDraw Arrows10 Technology
You can use text with any conceptDraw connectors to describe relationships between objects. Add text to connectors the same way you add text to any object - doubleclick a connector and type.HelpDesk
How to Make Network Diagram
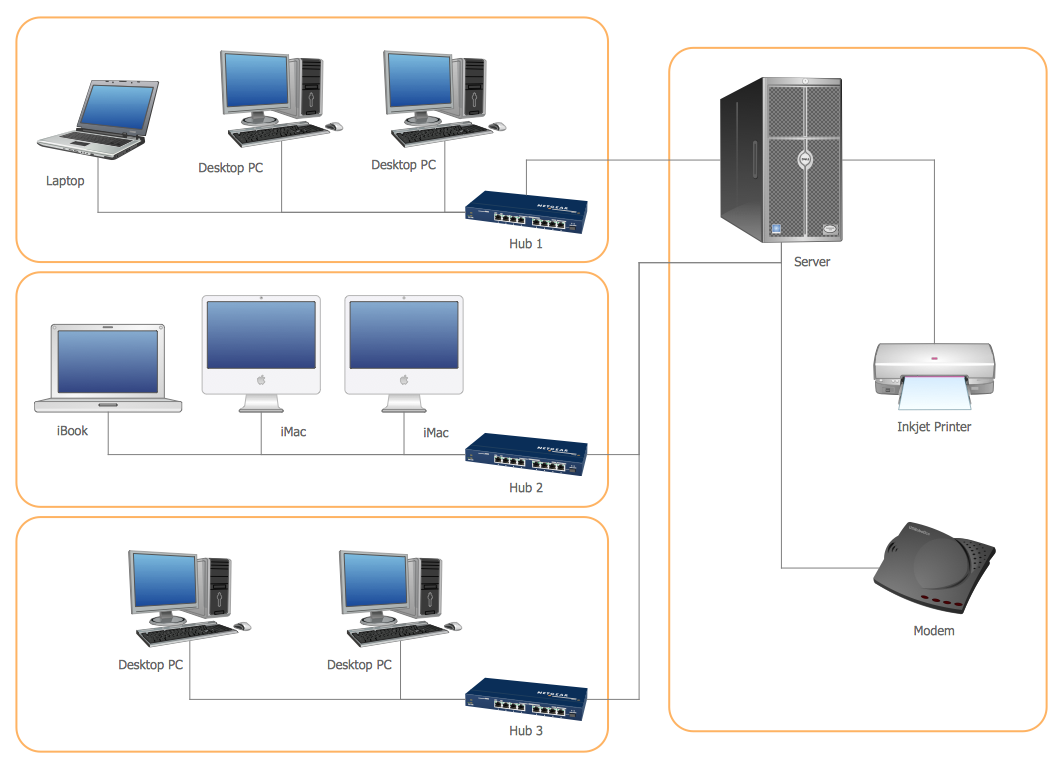
ConceptDraw PRO allows you to represent and communicate network architecture, topology, and design to engineers, stakeholders and end-users.HelpDesk
How to Create a Concept Map in ConceptDraw PRO
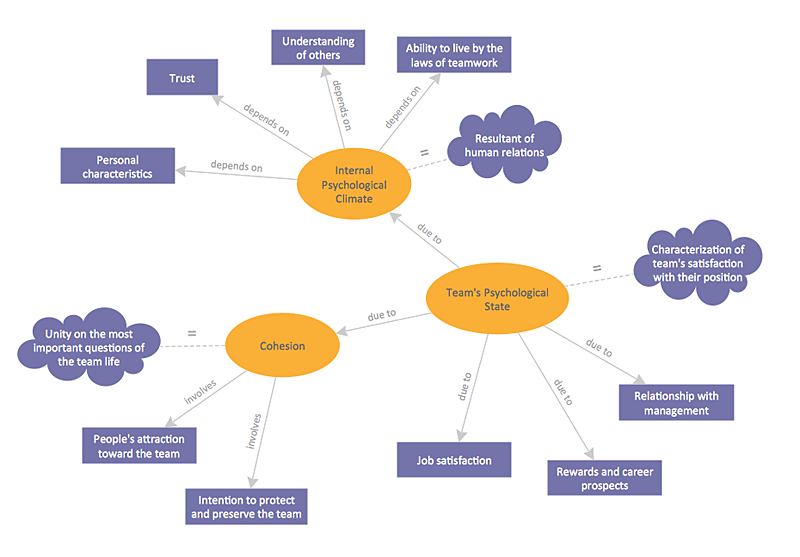
Graphical technique of knowledge representation in a form of structured networks of concepts (ideas) is called concept mapping. Concept network consists of shapes that represent concepts and connectors representing relationships between concepts. The difference between mind maps and concept maps is that a mind map has only one object depicting a main idea , while a concept map may have several. Concept mapping is used to structure ideas, to communicate complex system of knowledge, to help learning process, etc. ConceptDraw PRO allows you to draw concept maps using the Concept Map solution.ConceptDraw Arrows10 Technology
ConceptDraw Arrows10 Technology - This is more than enough versatility to draw any type of diagram with any degree of complexity.Basic Flowchart Symbols and Meaning
Flowcharts are the best for visually representation the business processes and the flow of a custom-order process through various departments within an organization. ConceptDraw PRO diagramming and vector drawing software extended with Flowcharts solution offers the full set of predesigned basic flowchart symbols which are gathered at two libraries: Flowchart and Flowcharts Rapid Draw. Among them are: process, terminator, decision, data, document, display, manual loop, and many other specific symbols. The meaning for each symbol offered by ConceptDraw gives the presentation about their proposed use in professional Flowcharts for business and technical processes, software algorithms, well-developed structures of web sites, Workflow diagrams, Process flow diagram and correlation in developing on-line instructional projects or business process system. Use of ready flow chart symbols in diagrams is incredibly useful - you need simply drag desired from the libraries to your document and arrange them in required order. There are a few serious alternatives to Visio for Mac, one of them is ConceptDraw PRO. It is one of the main contender with the most similar features and capabilities.
HelpDesk
How to Create a SDL Diagram
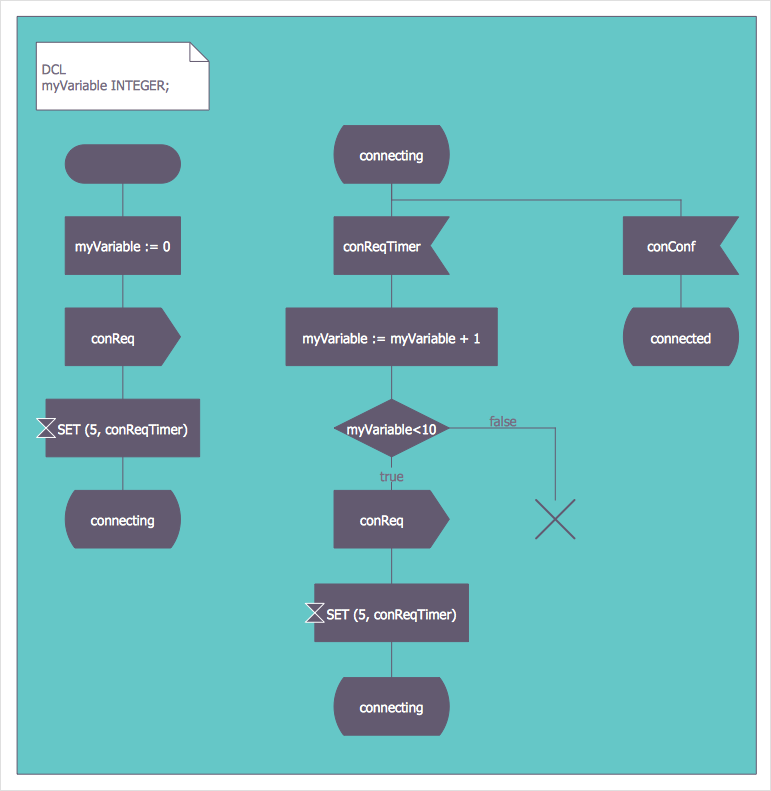
Specification and Description Language (SDL) is intended to describe systems that switched state often and rapidly. An SDL diagram is a view of system, that can depict a single process, or complex relationships between a number of elements. The SDL diagram supports a nested hierarchy. A system is devided into blocks, each of them can be describes as a process, until finally one can see the initial procedures that make up each process. The advantage of this method is that a system can be viewed in manageable part thatcan be followed separately. ConceptDraw Specification and Description Language solution contains the library, with a SDL notation in a vector stencil graphics. The SDL solution also provides a set of samples, to show the level of hierarchical detail that is possible.HelpDesk
How to Create a Bubble Diagram Using ConceptDraw PRO
Bubble Diagram is a simple chart that consists of circles (bubbles) repesening certain topics or processes. Bubbles are connected by lines depicting the type of relationships between the bubbles. The size of each bubble is depended on the importance of the entity it represents. Bubble charts are widely used throughout social, economical, medical, and other scientific researches as well as throughout architecture and business management. Bubble charts are often used during the early stages of product development to visualize thoughts and ideas for the purpose of sketching out a development plan. ConceptDraw PRO allows you to draw a bubble diagrams using the Bubble Diagrams solution.HelpDesk
How to Draw a Chemical Process Flow Diagram
Process Flow Diagram widely used in modeling of processes in the chemical industry. A Chemical Process Flow diagram (PFD) is a specialized type of flowchart. With the help of Chemical Process Flow Diagram engineers can easily specify the general scheme of the processes and chemical plant equipment. Chemical Process Flow Diagram displays the real scheme of the chemical process, the relationship between the equipment and the technical characteristics of the process. Chemical Process Flow Diagram illustrates the connections between the basic equipment as well as the overall structure of pipelines and other supporting equipment. The purpose of the PFD is to build the image of the basic idea of the chemical process. ConceptDraw PRO together with its Chemical and Process Engineering solution delivers the possibility to design Chemical Process Flow diagrams. It is designed for chemical industry engineers and designers.HelpDesk
How to Add a Bubble Diagram to PowerPoint Presentation
Bubble diagrams can be used to compare concepts, and identify areas of similarity and difference. ConceptDraw PRO allows you to make a MS PowerPoint Presentation from your charts in a few simple steps.Developing Entity Relationship Diagrams
When you need to visually represent the structure of relational database, Entity relationship diagram (ERD) is a type of diagram for that case. Most entity-relationship diagrams can be built with objects from Flowchart solution or ERD Solution which contains inbuilt templates. Follow these steps to create your own custom ERD diagram. Don't be frightened if it looks complex, ConceptDraw PRO makes it easy to create an ERD, and hundreds of other diagrams, in minutes.ConceptDraw Arrows10 Technology
How should diagramming software work? Is it possible to develop a diagram as quickly as the ideas come to you? The innovative ConceptDraw Smart Connectors Technology - This is more than enough versatility to draw any type of diagram with any degree of complexity. Connection points are necessary for diagramming network, flowchart and organizational charts. In ConceptDraw you connect shapes by attaching, or snapping and gluing, connectors to shape connection points.GUI Prototyping with ConceptDraw PRO
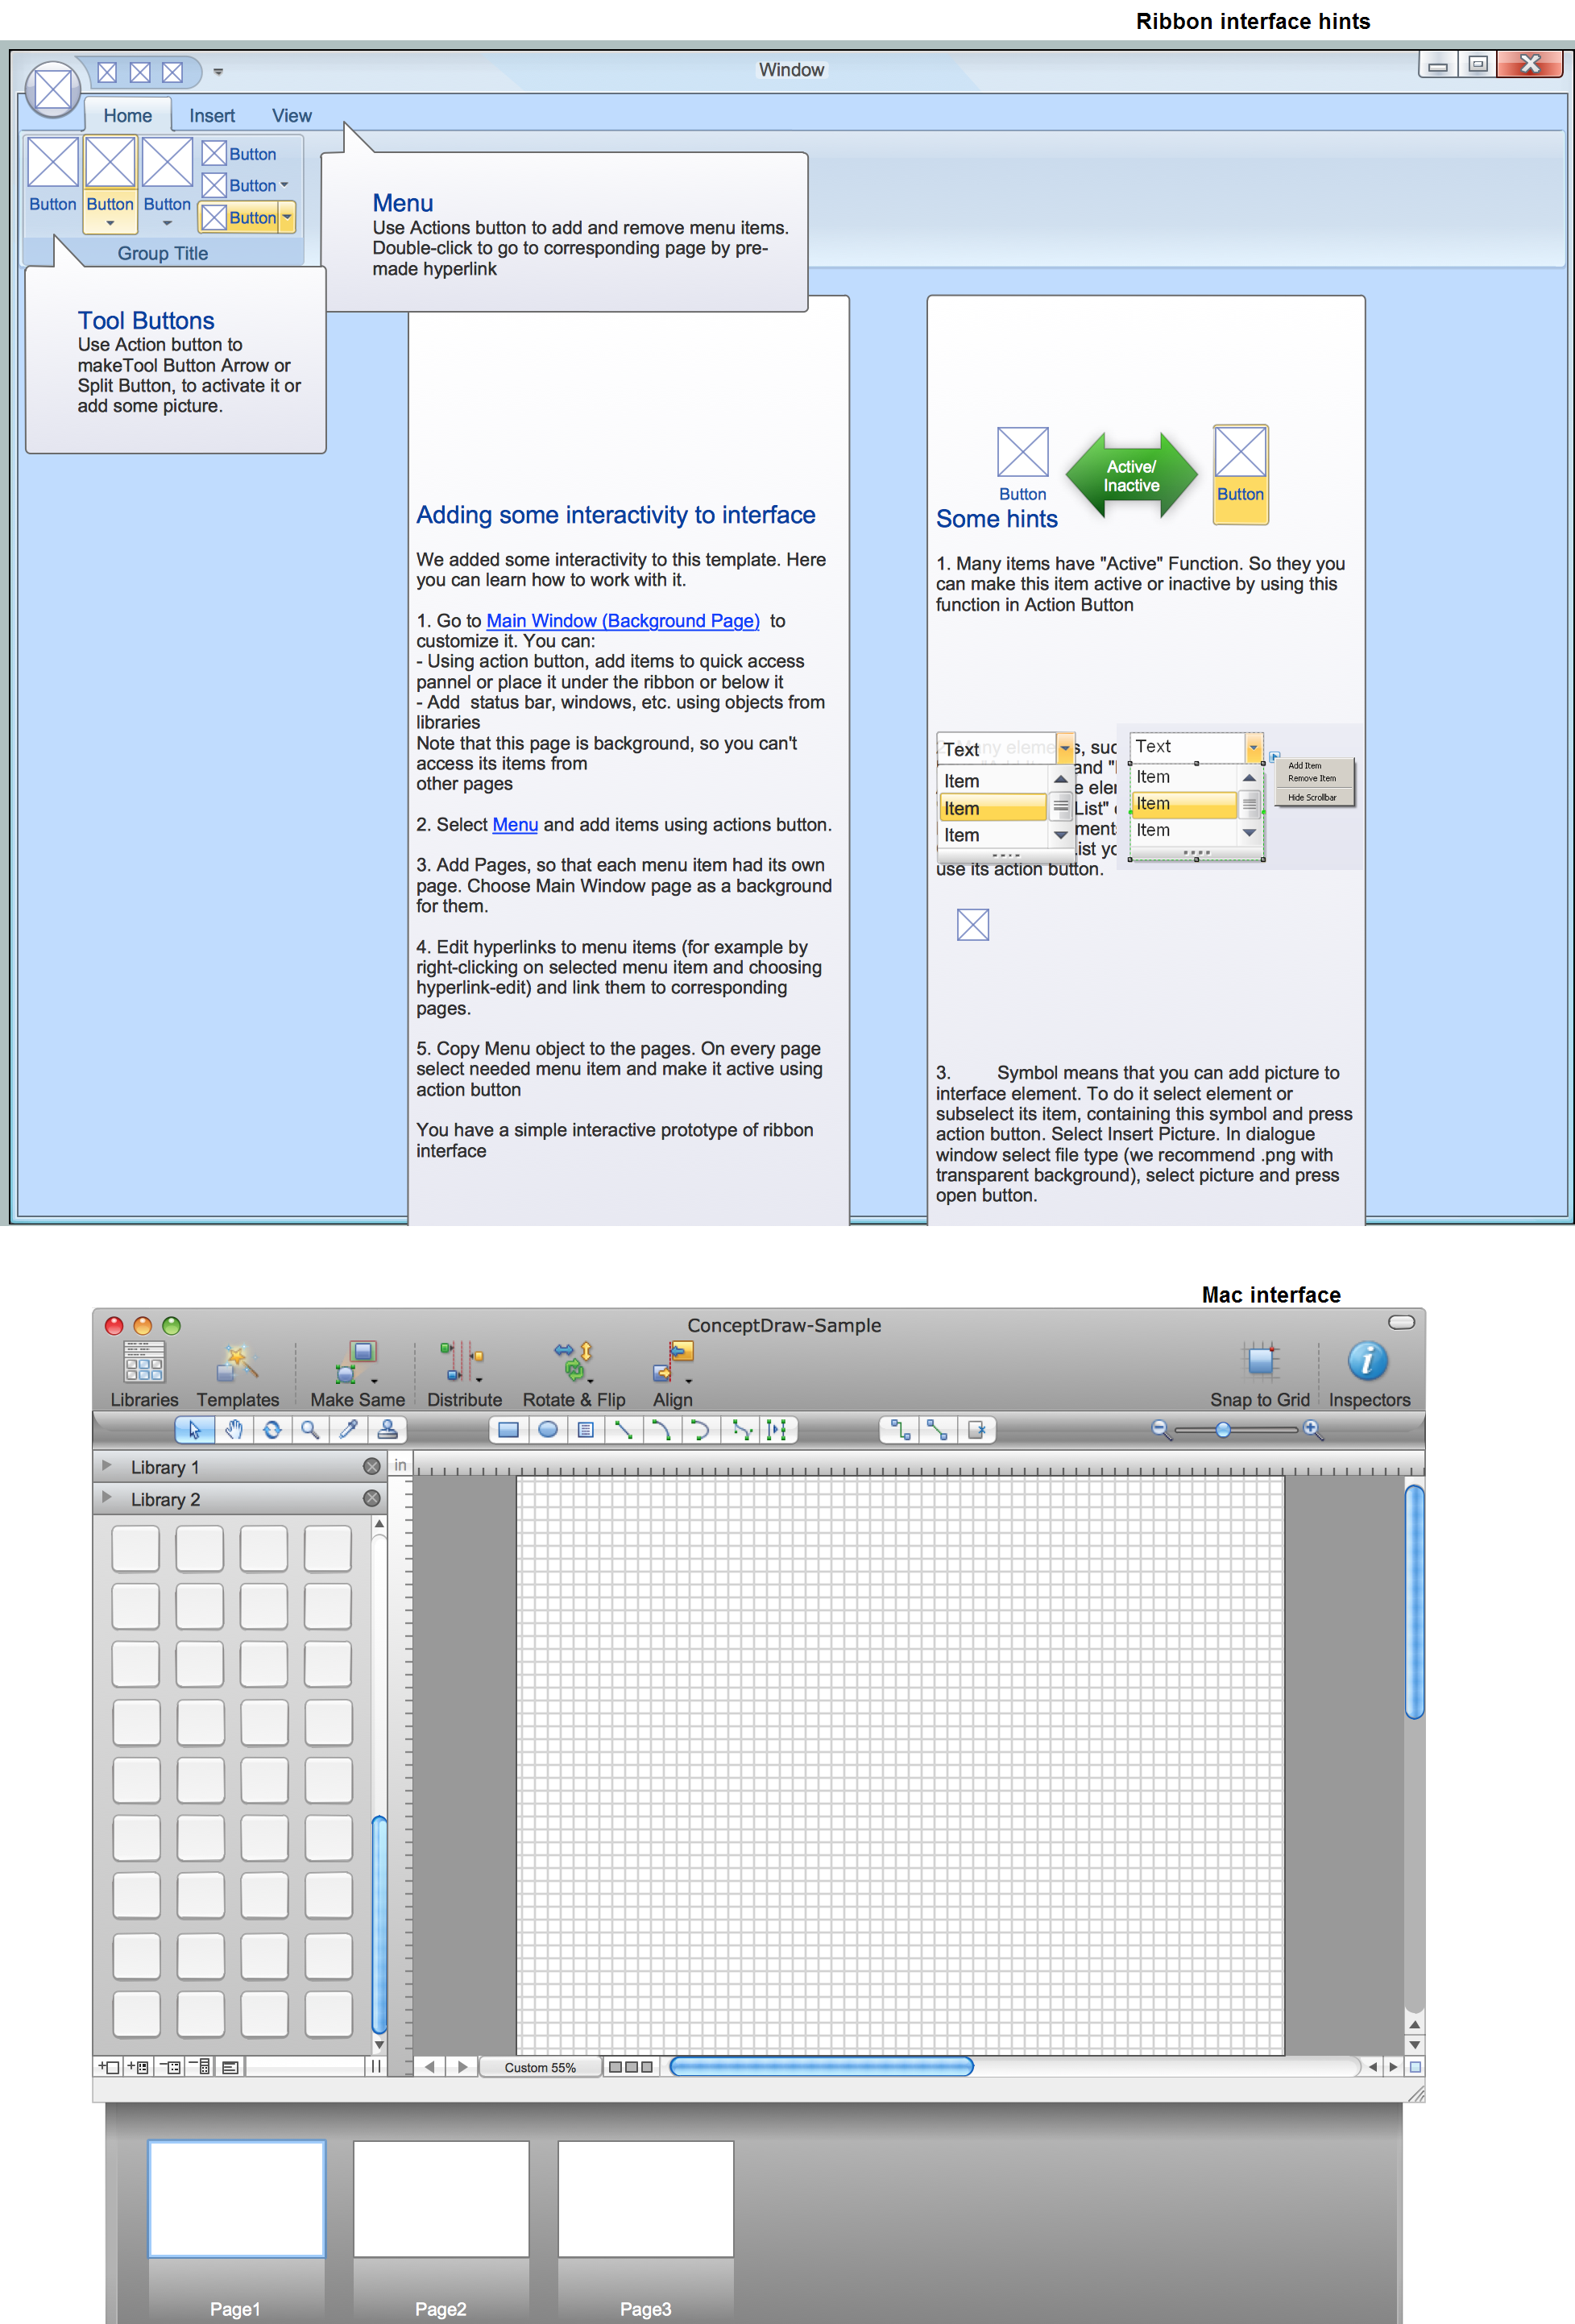
All about prototyping. GUI Prototyping with ConceptDraw. Download prototyping software.- How to Add Text to a Connector in ConceptDraw PRO | Swim Lane ...
- How to Add Text to a Connector in ConceptDraw PRO | How to ...
- How to Add Text to a Connector in ConceptDraw PRO | How to Draw ...
- How to Add Text to a Connector in ConceptDraw PRO ...
- Welcome to Improved ConceptDraw Help Desk
- How to Set Line Jumps for Smart Connectors in ConceptDraw PRO ...
- How to Add Text to a Connector in ConceptDraw PRO | How to Edit ...
- How to Add Text to a Connector in ConceptDraw PRO | Progressive ...
- How to Add Text to a Connector in ConceptDraw PRO | How to ...
- ConceptDraw News | Latest Updates to ConceptDraw Help Desk
- How to Add Text to a Connector in ConceptDraw PRO | How to Draw ...
- How to Add Text to a Connector in ConceptDraw PRO | Flowchart ...
- UML Component Diagram. Design Elements | How to Add Text to a ...
- Basic Flowchart Symbols and Meaning | How to Add Text to a ...
- How to Connect Objects in ConceptDraw PRO on PC | Electrical ...
- How to Add Text to a Connector in ConceptDraw PRO ...
- How to Create a Bank ATM Use Case Diagram Using ConceptDraw ...
- How to Add a Bubble Diagram to a PowerPoint Presentation Using ...
- How to Add Text to a Connector in ConceptDraw PRO ...
