ConceptDraw DIAGRAM Compatibility with MS Visio
Powerful business graphics and diagramming tools are the norms and not the exception for today’s businesses. For these important visual communication tools to do their job, it is often important that they be compatible with a file format that can be easily shared with others. For years the de facto standard file format for business has been Microsoft Visio™. Many people involved in visual communication need software tools that will read and write using the Visio file format.
The well-known MS Visio software has lots of better alternatives nowadays, such as, for example, a ConceptDraw DIAGRAM diagramming and drawing one, providing lots of solutions, useful for creating lots and lots of different charts, flowcharts, diagrams, maps, and other schematics.
Thus, using ConceptDraw DIAGRAM application you can always create any needed diagram, including a SSADM one, known to be widely used within the so-called “Structured Systems Analysis and Design Method”, which is also known to be a “waterfall” one, meaning that it is a “non-iterative design process” used in the different development processes of software. The method uses the progress as a “flowing steadily downwards” reminding a “waterfall”. These mentioned “downwards” go through the phases of design, initiation, conception, analysis, testing, construction, production, implementation and maintenance. “SSADM” is used in the analysis while designing different information systems, contrasting with more contemporary “agile” methods, such as “Scrum”, “DSDM”. Using this method, which is basically a particular implementation, with help of which you can build the work of different schools of the development methods, analysis, design, etc., you can always create any SSADM diagram representing and describing the system.
A chart or a “graph” can be also always made in ConceptDraw DIAGRAM diagramming and drawing software, being simply a graphical representation of data, where this particular data is represented with the help of the design symbols, which all can be found in the solutions we mentioned above as each solution, developed for the purpose of helping the ConceptDraw DIAGRAM users to make charts, consists at least one stencil library with the design elements, which all can be used for your drawings. You can make “line charts”, “bar charts”, “pie charts” and any other charts you need, improving the existing examples, given in each of the solutions or making your drawings from a scratch. Each chart can represent a so-called “tabular” data, which is numeric and which can be illustrated with the help of the mentioned above drawing software. You can make a “data chart”, which is a type of graph, with help of which it is easier to organize as well as to represent a set of both numerical or/and qualitative data.
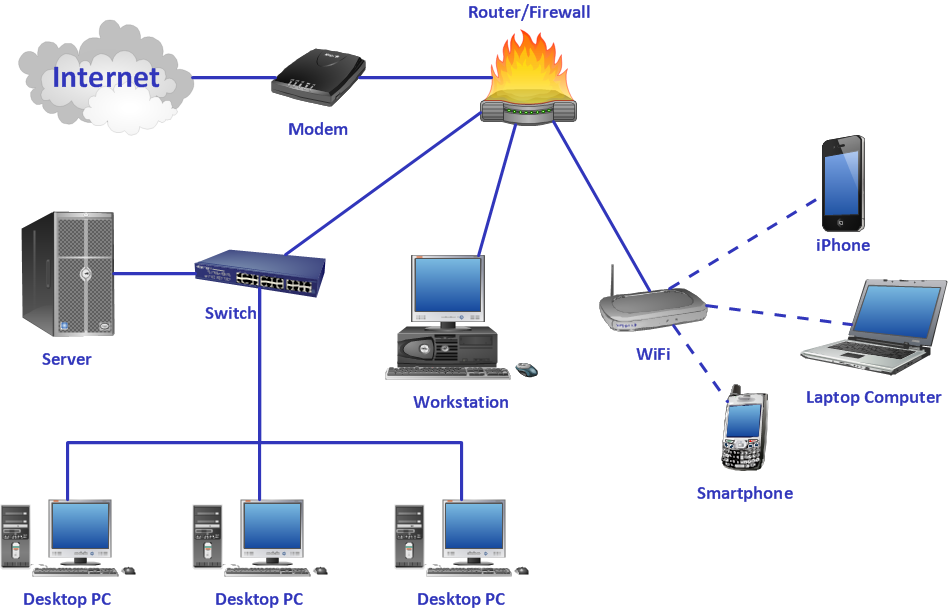
It is a well-known fact that Visio does not have a Mac OS X version. That is why all ConceptDraw DIAGRAM diagramming and drawing software users have an opportunity to use their favorite application to import and export the Visio files, as well as to open and edit these files on their Mac, apart from many other file formats. That’s why ConceptDraw DIAGRAM diagramming and drawing software is a great alternative to MS Visio on Mac, supporting import of MS Visio files, such as swim-lane diagrams, project charts, flowcharts, org-charts, cause-and-effect diagrams, decision tree charts, schemes, maps, graphs, plans and many other diagrams’, flowcharts’ and charts’ types, which all can be created within only a few hours or even minutes in case you have the pre-made solutions available to be found and downloaded from ConceptDraw STORE.
Comparing ConceptDraw DIAGRAM diagramming and drawing application and MS Visio application, it becomes obvious that the first one is much more convenient in use. Providing the pre-made examples and templates, the IT specialists of CS Odessa made ConceptDraw DIAGRAM diagramming and drawing application one of the best tools for drawing a large number of charts, flowcharts, maps, schemes, and plans. Having the previously created samples, which all can be found in the appropriate solutions on this site or from ConceptDraw STORE, means having an opportunity to draw your own great looking and professional looking charts, flowcharts, maps, diagrams and other schematics of any complexity.
ConceptDraw DIAGRAM Compare
| List | ConceptDraw DIAGRAM | MS Visio Professional |
| Features | ||
| Last version to sale | 12 | 2016 |
| OS | Win/macOS | Win |
| General Features | ||
| Multi-page Documents | + | + |
| Presentation mode | + | + |
| Sample diagrams supplied with program | + | + |
| Smart Connectors | + | + |
| Spline tool | + | |
| Shape Sheet | + | + |
| Dropper tool | + | |
| Locking various object properties from changing | + | + |
| Ability to edit a group (set text, fill, set line properties and etc.) | + | + |
| Library navigator window | + | + |
| Find objects in libraries | + | + |
| Set of predefined units of measurement | + | + |
| Alpha Channel support (opacity/transparency) | + | + |
| Built-in scripting language | + | + |
| Extend application possibilities with plug-ins | + | + |
| Extended hyperlinks | + | + |
| Background pages support | + | + |
| Texture fill | + | |
| Layers | + | + |
| Guide Lines | + | + |
| Corner Rounding | + | + |
| Customizable tools | ||
| Ability to create objects with userdefined behavior | + | + |
| Userdefined actions with objects | + | + |
| Supports Custom (or user-defined) Properties for shapes | + | + |
| Integration and sharing | ||
| Opens Visio 2003-2016 files | + | + |
| Import PowerPoint documents | + | |
| Export to PowerPoint documents | + | |
| Import PDF | + | |
| Export to PDF | + | |
| Export to EPS | + | |
| Supports own XML format | + | + |
| Export to HTML | + | |
| Export to SVG | + | + |
| Integration with mind mapping tool | + | |
| Integration with Project Management tool | + | |
| Libraries | ||
| OS X interface libraries | + | |
| Ribbon interface library | + | |
| Building, space, and floor plans | + | + |
| Directory services diagrams | + | + |
| Engineering diagrams—electrical, chemical, and more | + | + |
| Logical network diagrams | + | + |
| Network rack diagrams | + | + |
| Software diagramming | + | + |
| Value stream maps | + | + |
Having the stencil libraries full of design elements available in the solutions from Solution Park on this site and from ConceptDraw STORE means having enough tools for making any drawings getting the smart and great looking result only in a few minutes if you are good at using ConceptDraw DIAGRAM diagramming and drawing software already. Even if you never had any opportunity to learn how to make such drawings, you can feel as if you were a professional designer making smart plans, great looking schemes, professionally looking charts as well as complex flowcharts.
You can always import files, which were previously created in MS Visio, to ConceptDraw DIAGRAM diagramming and drawing application to use them, inserting new data and improving the way they look. To continue working with previously created files in MS Visio, you can simply import them to ConceptDraw DIAGRAM diagramming and drawing and to improve their content any time it’s needed. In this way, it will be simpler for all the MS Visio users to get used to ConceptDraw DIAGRAM diagramming and drawing application step by step, as ConceptDraw DIAGRAM diagramming and drawing is known to be a better as well as more convenient software, which you can always use on your Mac.

Pic.1. Diagrams
This examples illustrates how MS Visio 2016 diagram (VSDX file format) has been converted into ConceptDraw DIAGRAM diagram.
ConceptDraw DIAGRAM being an application, compatible with MS Visio formatted files, is an application you need to be using as long as you want to continue your work with MS Visio files, but in a better software. Thus, all MS Visio files can be imported as well as exported and converted to be used while working in ConceptDraw DIAGRAM diagramming and drawing software — the one, compatible with all Visio formats while creating any needed schematics and other drawings. Having this new opportunity now to work with the documents, created in MS Visio, but using ConceptDraw DIAGRAM diagramming and drawing, can help more people to switch to the better application, which is ConceptDraw DIAGRAM one.


This sample shows the Workflow Diagram that clearly illustrates stages a BPM consists of and relations between all parts of business. The Workflow Diagrams are used to represent the transferring of data during the work process, to study and analysis the working processes, and to optimize a workflow.