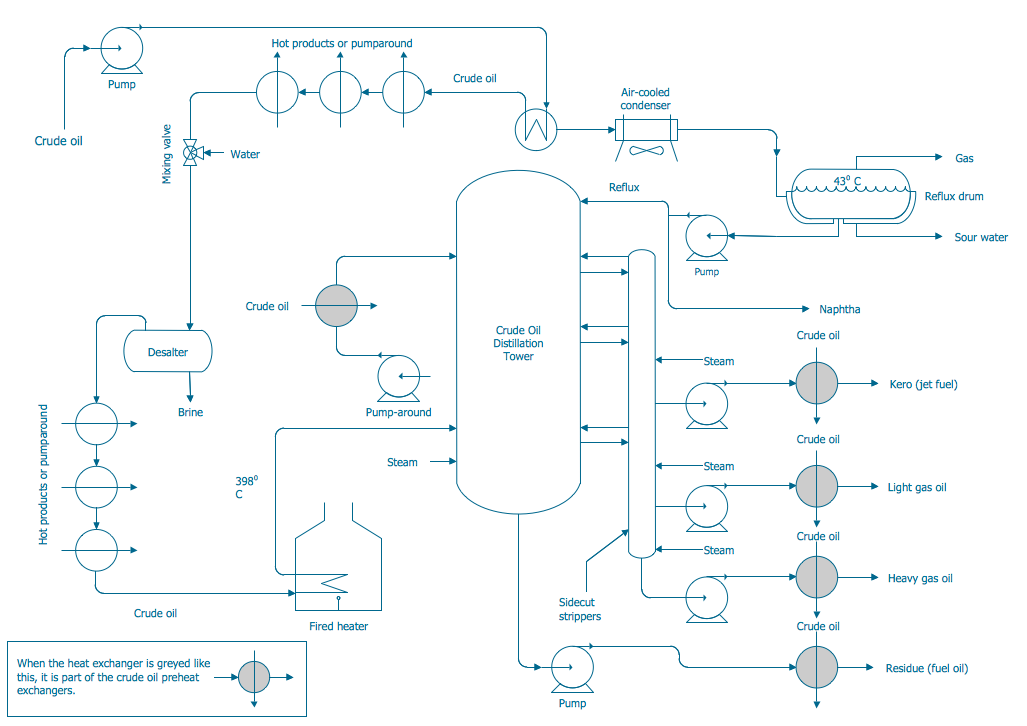
Example 1. Process and Instrumentation Diagram
Chemical and Process Engineering Solution contains all needed tools for designing the Process and Instrumentation Diagram of any complexity. At your disposal are 8 libraries with 468 predesigned vector objects which are simply indispensable for easy drawing:
- Chemical Engineering
- Heating Equipment
- Industrial Equipment
- Instruments
- Process Annotations
- Pumps
- Valves and Fittings
- Vessels

Example 2. Chemical and Process Engineering Solution in ConceptDraw STORE
ConceptDraw STORE offers you collection of various Chemical and Process Engineering Diagrams, including the Process and Instrumentation Diagram sample and template for creating your own diagram.

Example 3. Piping and Instrumentation Diagram Template
The Process and Instrumentation Diagram you see at the top of this page was created in ConceptDraw DIAGRAM software using the tools of Chemical and Process Engineering Solution. An experienced user spent 20 minutes creating this professional looking sample.
Use the Chemical and Process Engineering Solution for ConceptDraw DIAGRAM Solution Park to create your own Process and Instrumentation Diagram of any complexity quick, easy and effective.
All source documents are vector graphic documents. They are available for reviewing, modifying, or converting to a variety of formats (PDF file, MS PowerPoint, MS Visio, and many other graphic formats) from the ConceptDraw STORE. The Chemical and Process Engineering Solution is available for all ConceptDraw DIAGRAM or later users.
TEN RELATED HOW TO's:
The fundamental concepts of electrical engineering in our detailed guide. ✔️ Discover essential electrical engineering software tools. 🔸 The main types of electrical engineering you need to know in this article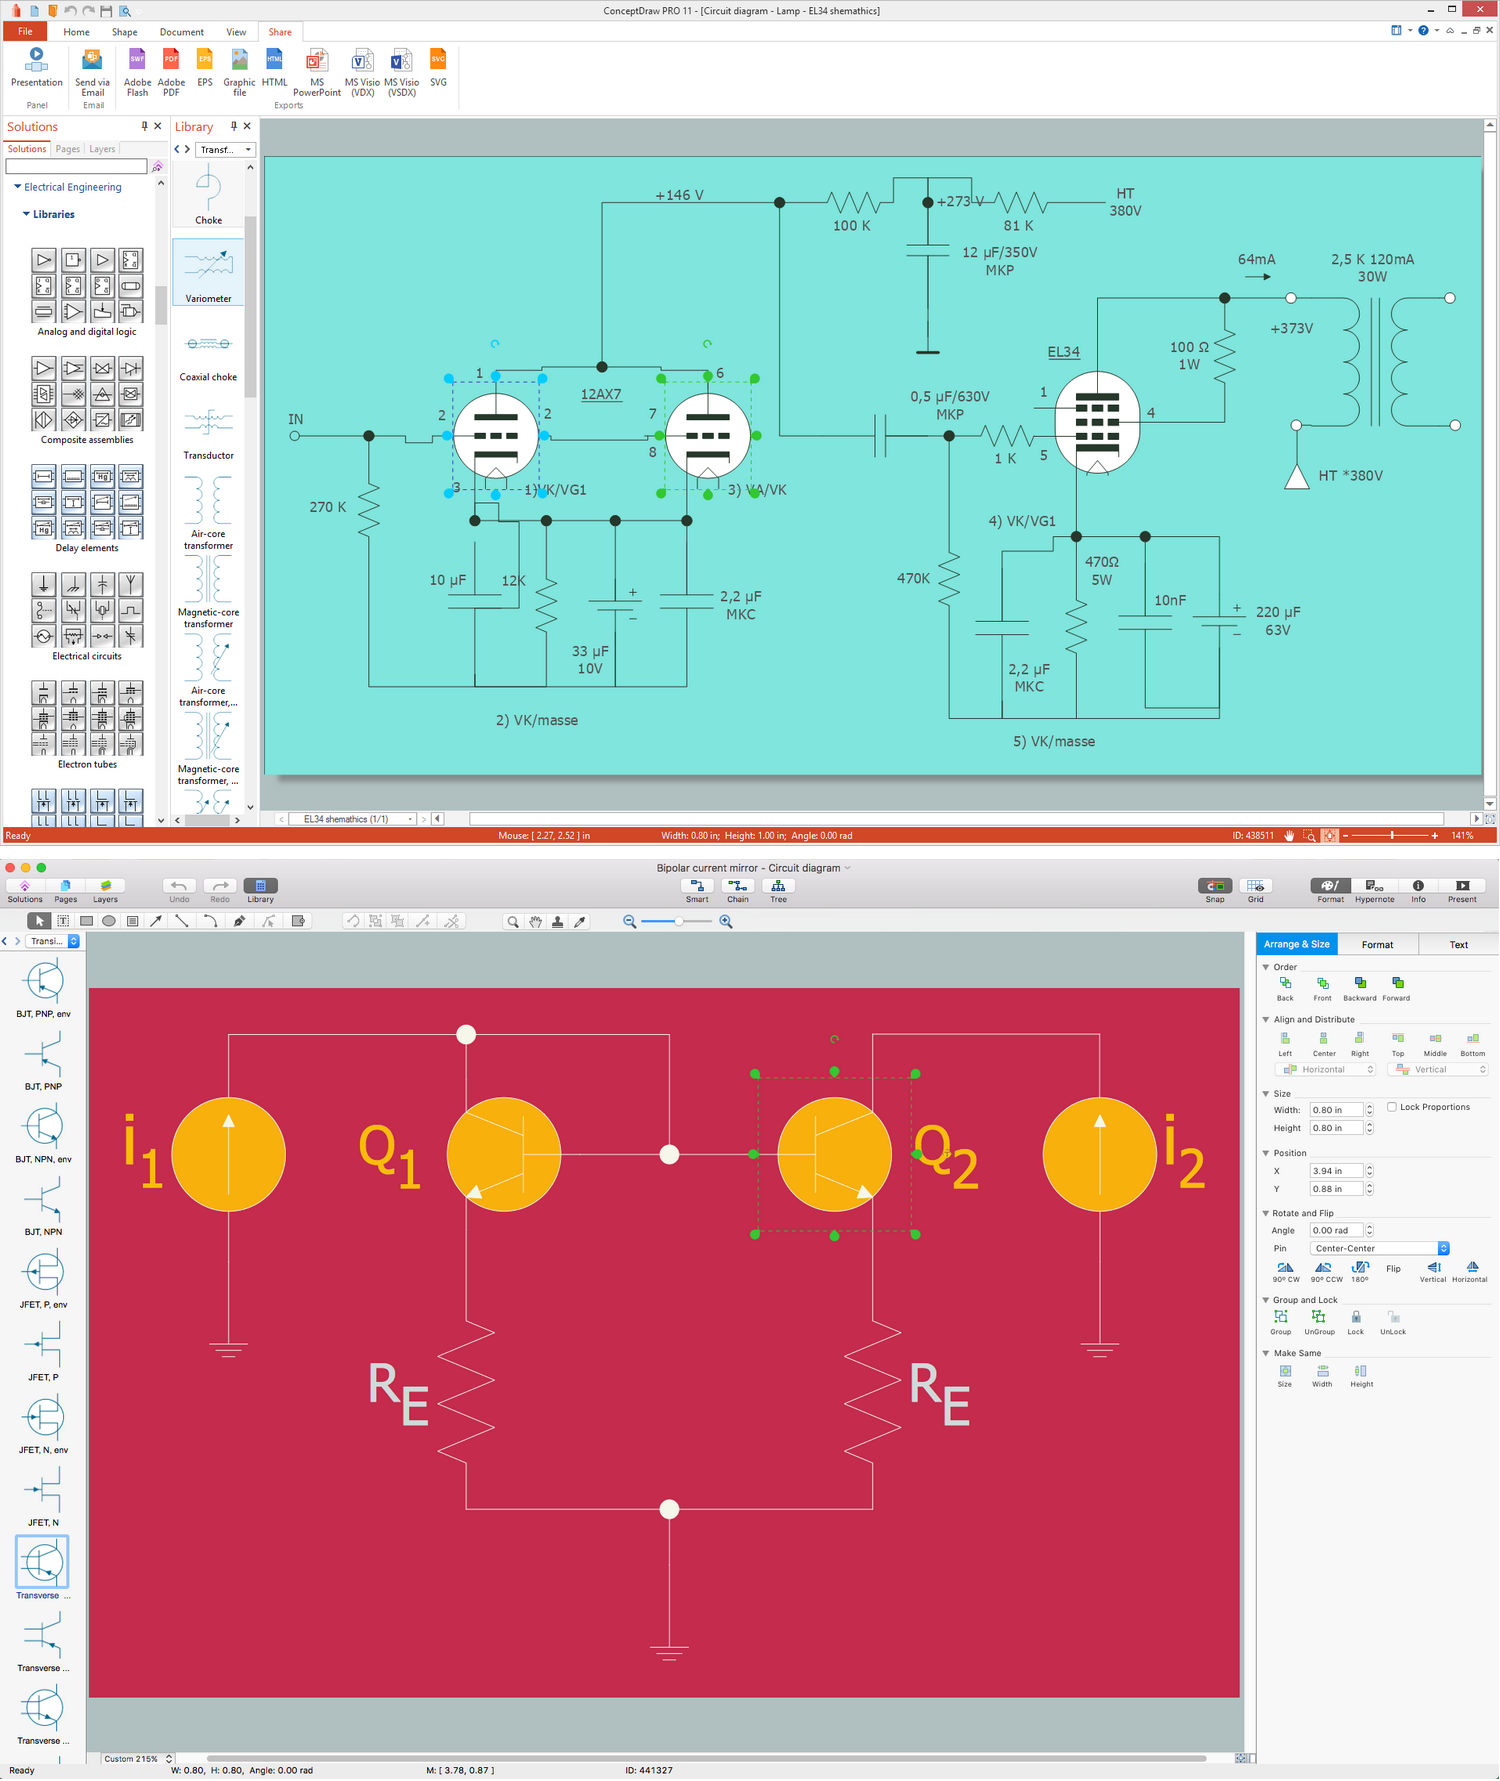
Picture:
What is Electrical Engineering?
Basic Electrical Engineering Software
Related Solution:
Mechanical design is a labour-intensive process. To facilitate the task of Mechanical Engineering Diagrams creating, ConceptDraw DIAGRAM diagramming and vector drawing software was extended with Mechanical Engineering solution from the Engineering area. Now, ConceptDraw DIAGRAM is a powerful Mechanical Design Software.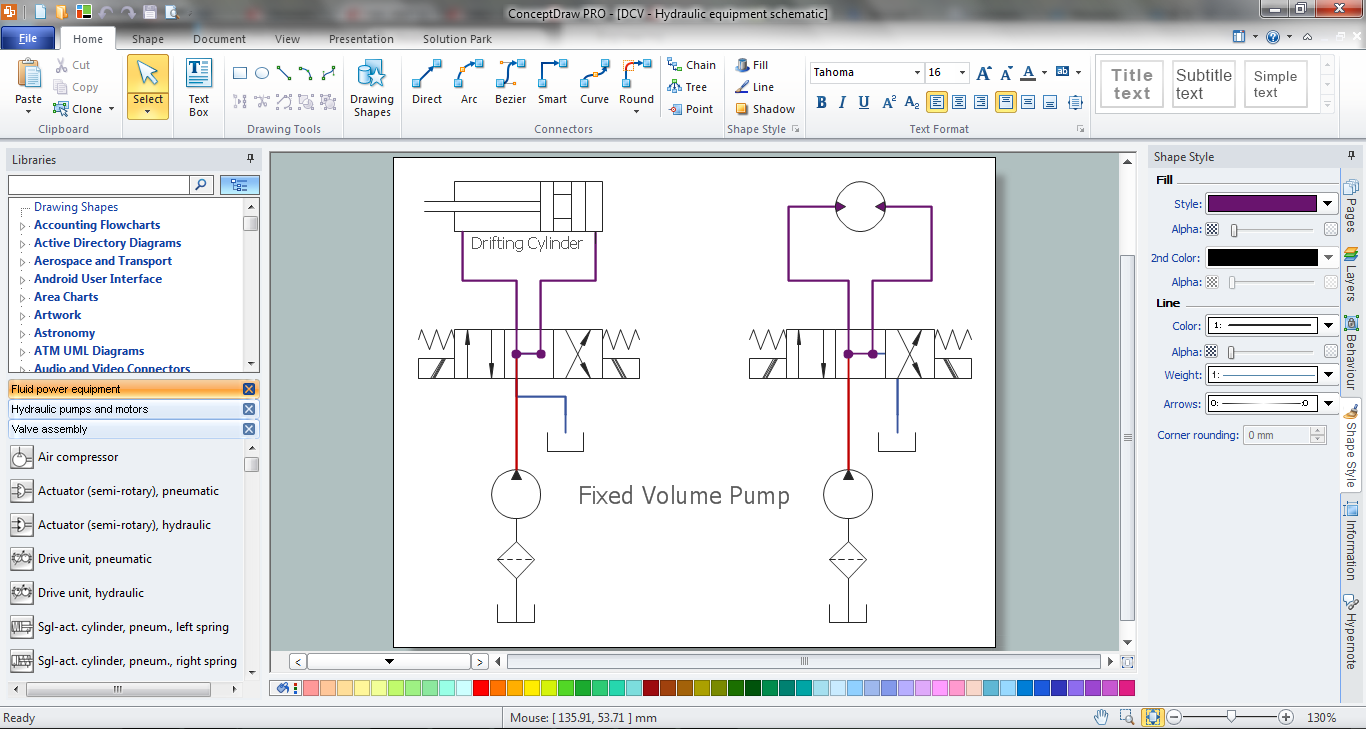
Picture: Mechanical Design Software
Related Solution:
Developing Restaurant Layouts is very important and responsible moment in restaurant construction and designing. Now it's very simple and fast process thanks to the Cafe and Restaurant Floor Plans solution from the Building Plans area of ConceptDraw Solution Park.
Picture: Restaurant Layouts
Related Solution:
ConceptDraw DIAGRAM is a powerful electrical design software. The Electrical Engineering solution from the Engineering area of ConceptDraw Solution Park allows you easy, quick and effective draw the professional looking electrical, circuit and wiring diagrams and schemes, maintenance and repair diagrams for electronics and electrical engineering, and many other types of diagrams.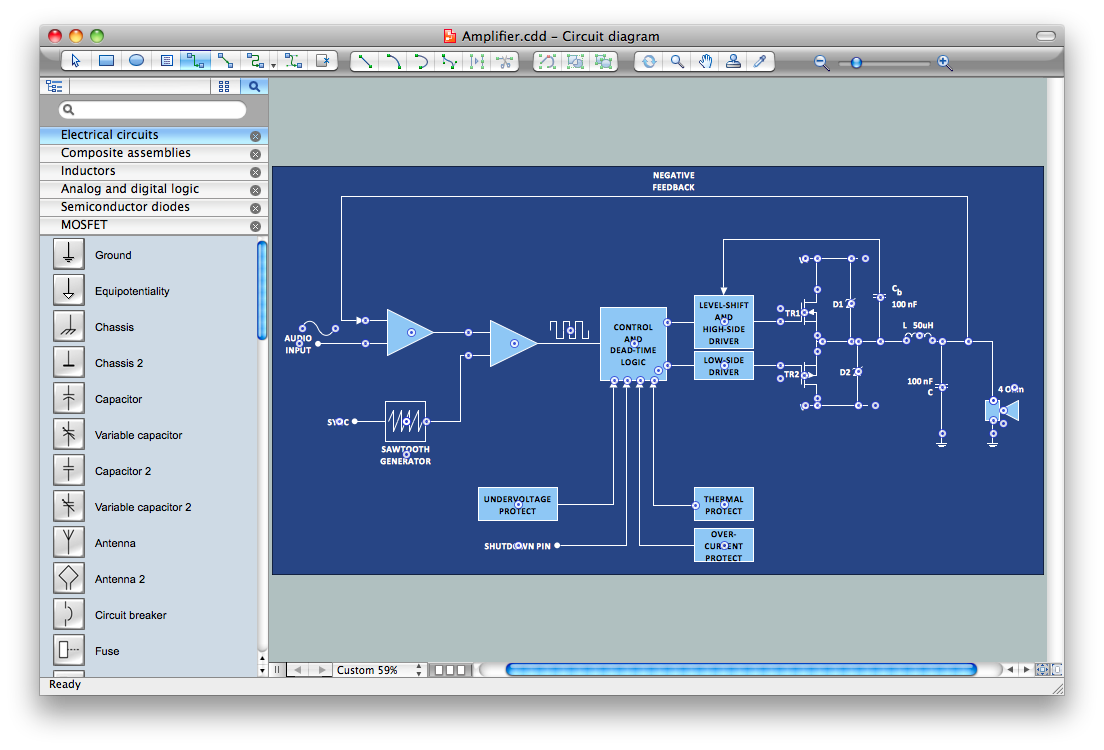
Picture: Electrical Design Software
Related Solution:
Pipe Bender Plans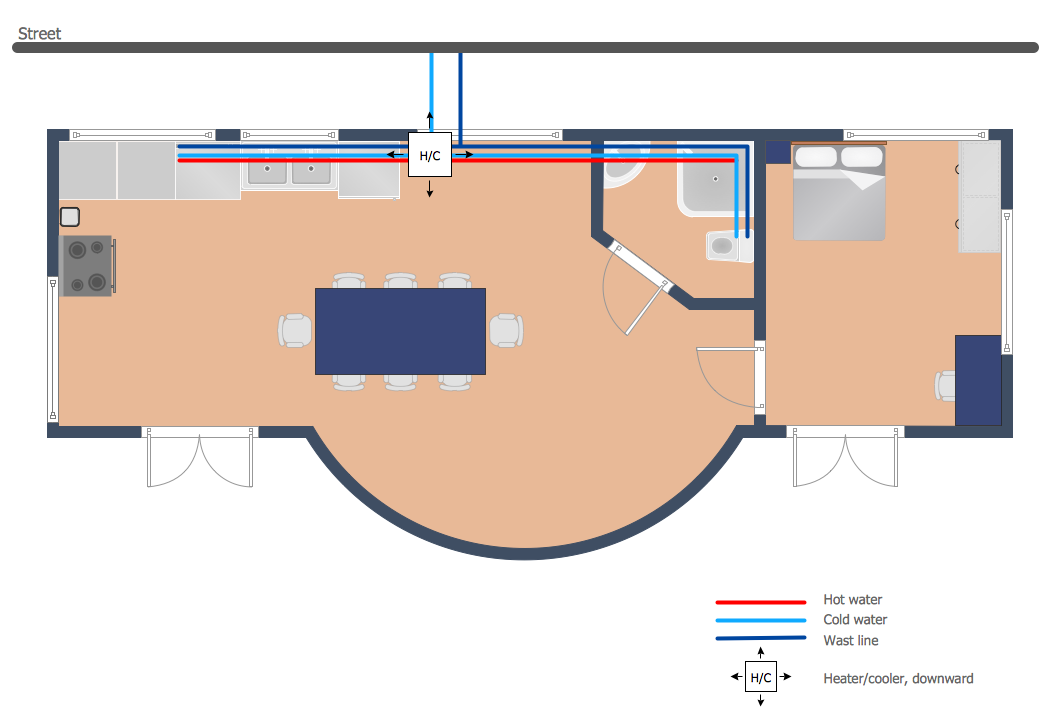
Picture: Pipe Bender Plans
Related Solution:
The chemical industry is a large industry of an international scale, which includes a lot of processes. ConceptDraw DIAGRAM with Chemical and Process Engineering solution included is useful for chemical engineers, process engineers, performance and compliance consultants to create Chemical Flow Chart fast and easy. It includes chemical symbols, elements used in PFDs, and a lot of examples. The included vector design elements correspond to ISO and ANSI standards and ensure a common understanding of the diagrams by any stakeholders.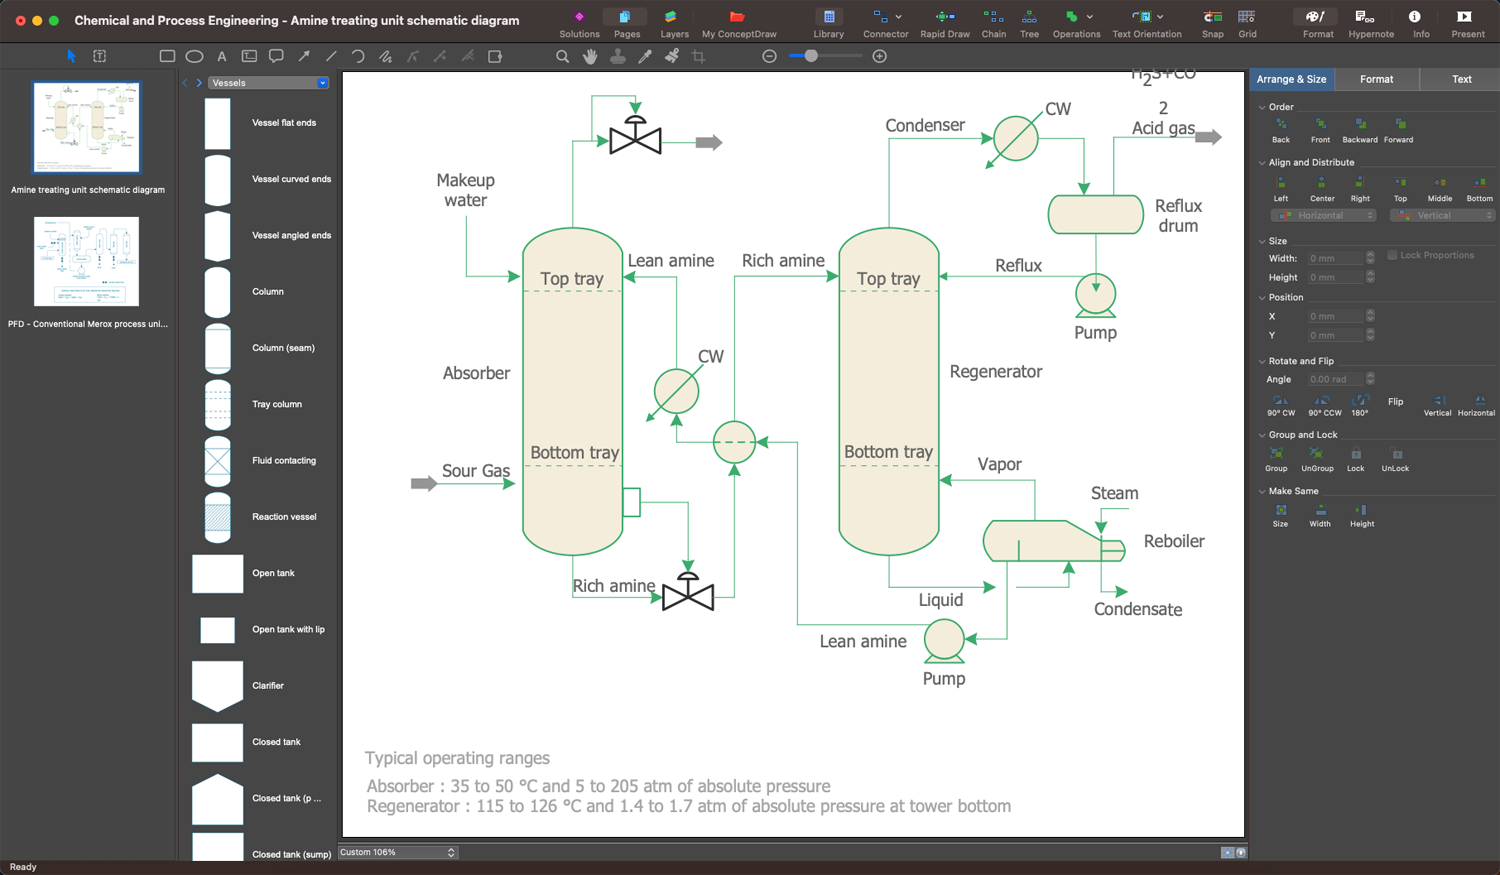
Picture: Chemical Flow Chart
Related Solution:
No need for any special drawing skills to create professional looking diagrams outside of your knowledge base. ConceptDraw DIAGRAM takes care of the technical details, allowing you to focus on your job, not the drawing.
ConceptDraw DIAGRAM delivers full-functioned alternative to MS Visio. ConceptDraw DIAGRAM supports import of Visio files. ConceptDraw DIAGRAM supports flowcharting, swimlane, orgchart, project chart, mind map, decision tree, cause and effect, charts and graphs, and many other diagram types.
Picture: MS Visio Look a Like Diagrams
Diagrams are a very important part of modern life. With the help of flow diagram software, a lot of companies can promote their ideas at the market. Its usefulness is totally doubtless.
This is a flow chart of the invoice payment flow. This flowchart details decrypts all stages of the process of obtaining and paying bills. It is a description of the universal process - such steps performs accounting departments of almost any organization. Since every business no matter what it does is a consumer of some goods or services. The given flow chart was made using ConceptDraw DIAGRAM software and the Diagrams solution for making flowcharts of any kind.
Picture: Flow Diagram Software
Related Solution:
Drawing an electric circuit plan with all the wiring might seem very complex. If you ever felt afraid to ask how to use electrical and telecom plan software, then it’s time to actually start from altering the templates from the Solution Park. You won’t even notice the moment when you would become an experienced user.
This electrical and telecommunication floor plan plan presents electrical and telecommunication devices located in a country house floor plan. Each electrical or telecom device on this plan is indicated with the particular symbol. Using standard Electrical and Telecommunication symbols makes this floor plan clear for anybody who will be involved into construction process. All the electrical and telecom symbols used in the current floor plan are placed to a legend. This electrical and telecom floor plan can be included as a separate piece into a package of building documentation.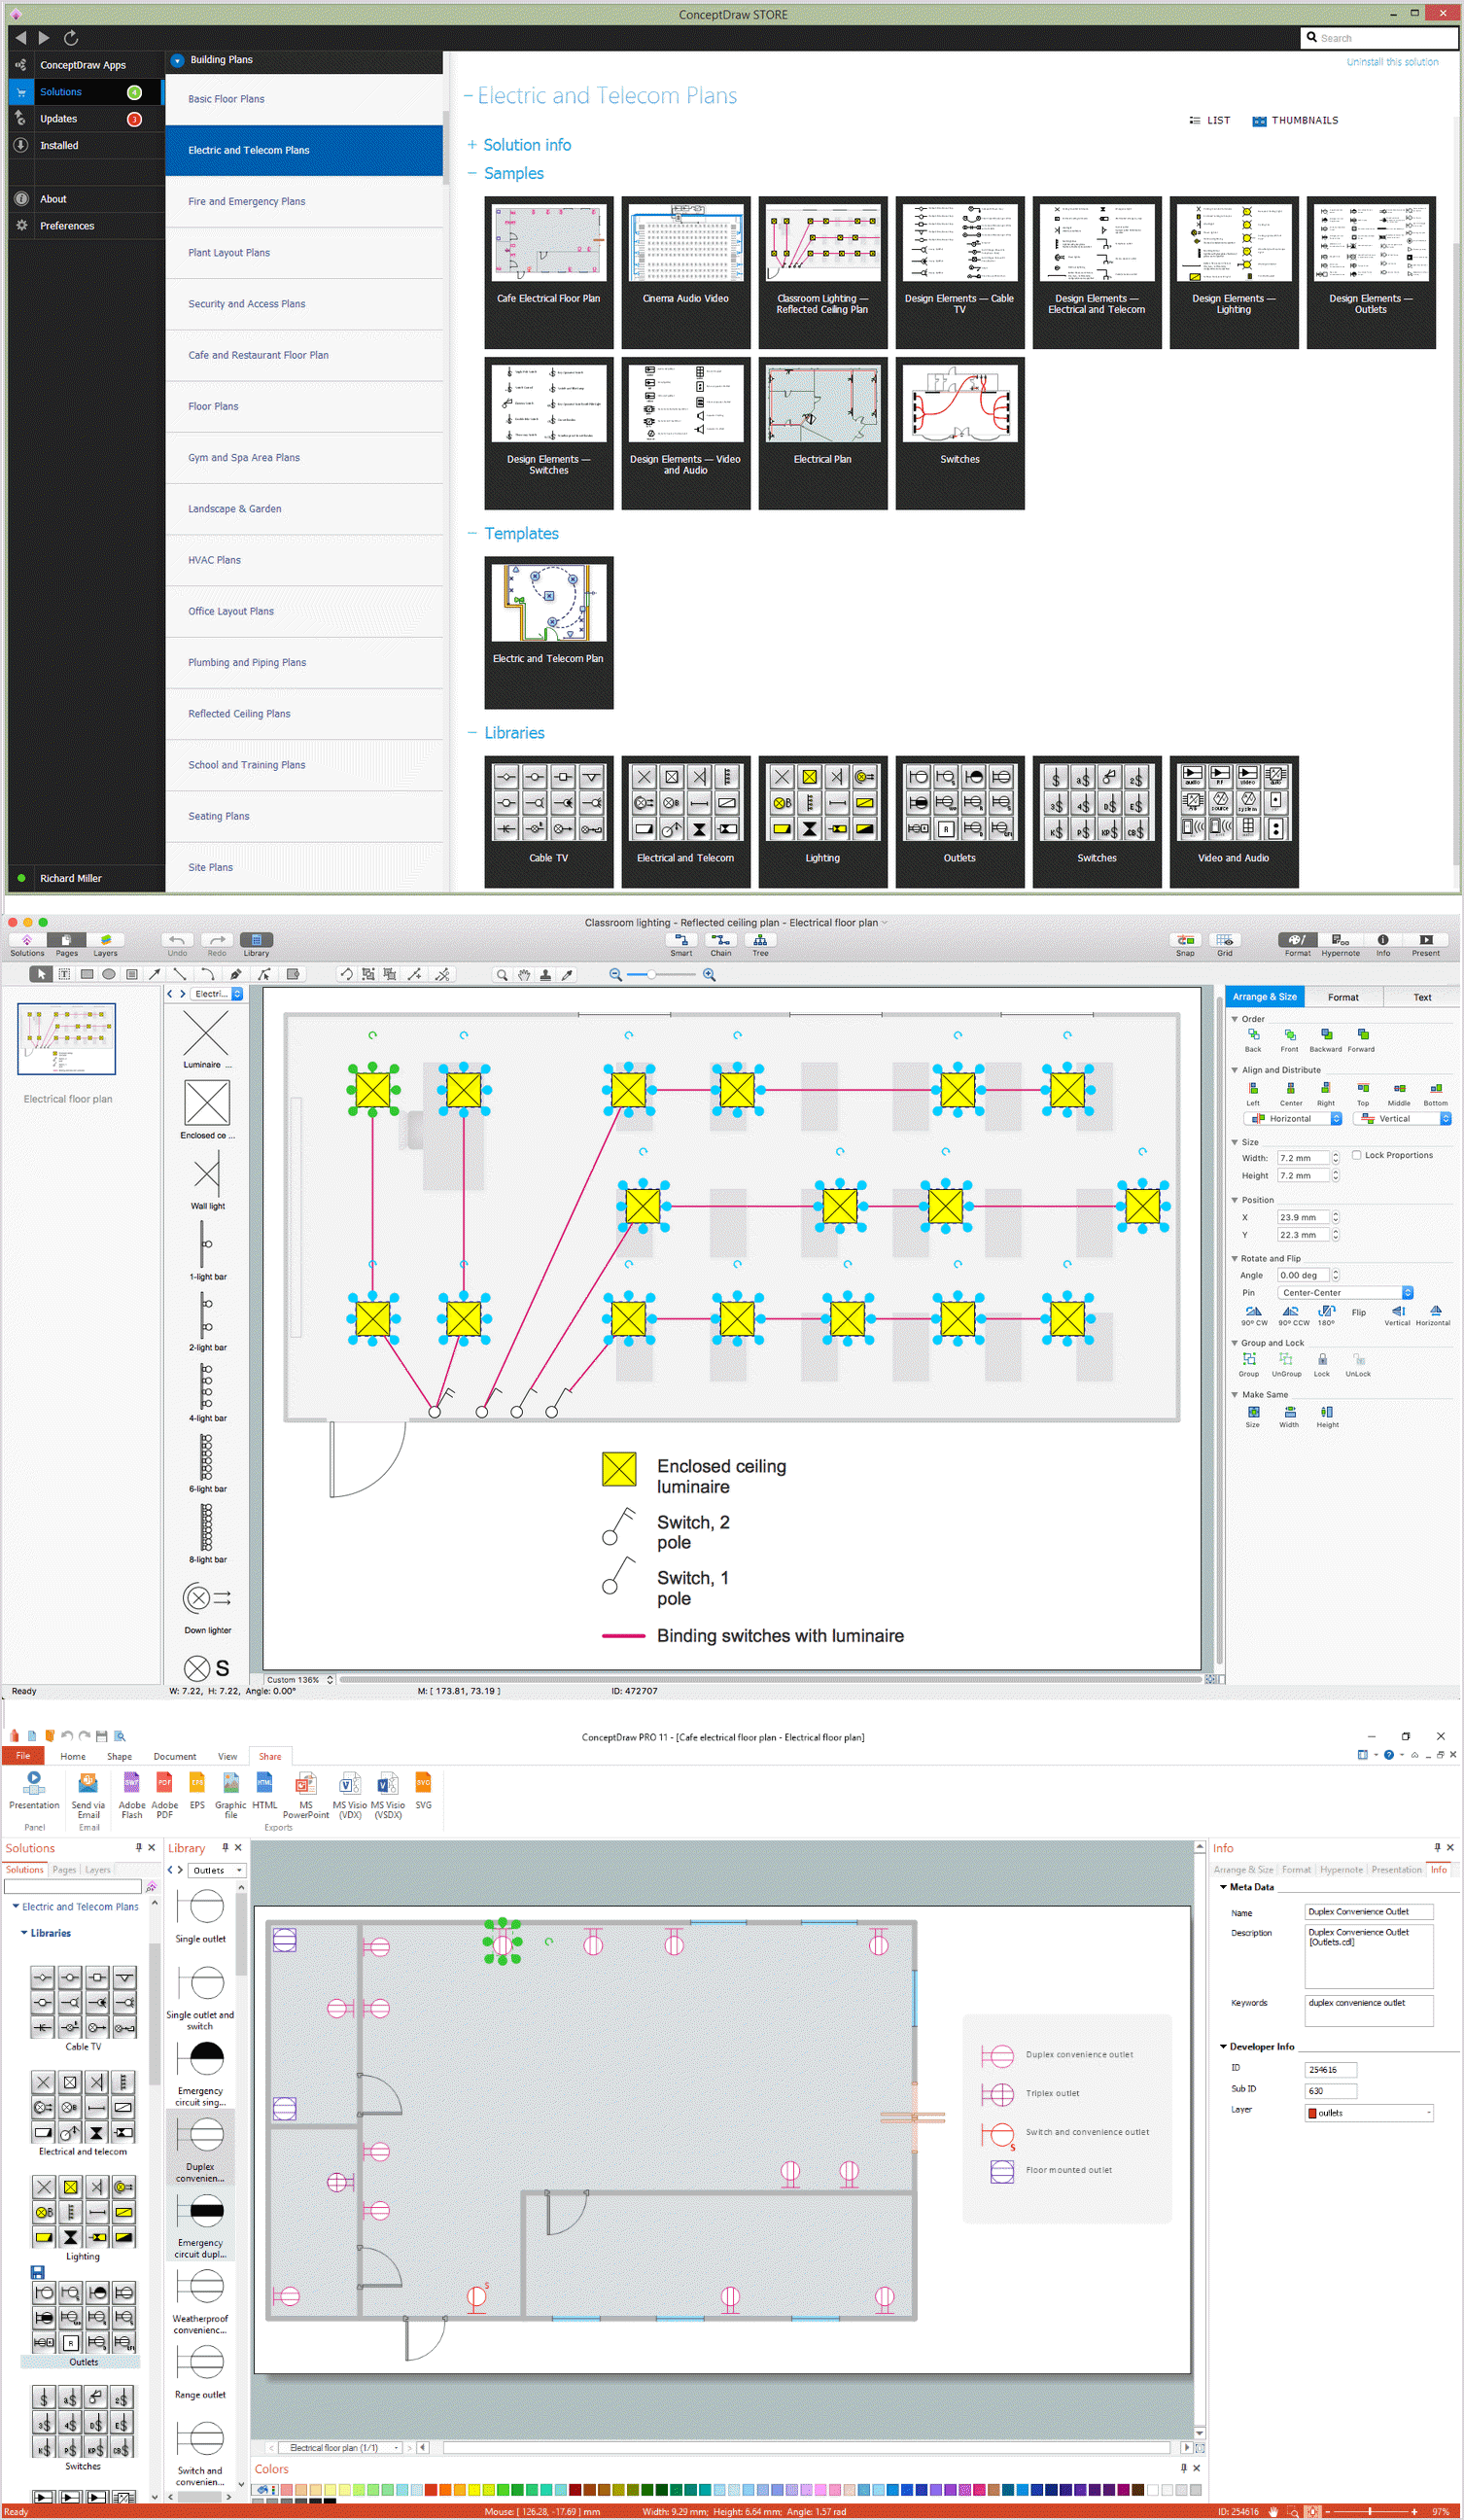
Picture: How To use Electrical and Telecom Plan Software
Related Solution:
ConceptDraw has 142 vector stencils in the 8 libraries that helps you to start using software for designing own Business Process Diagrams. Use Swimlanes library with 20 objects from BPMN.
Picture: Business Process Elements: Swimlanes
Related Solution:

