Pie Chart Software
A common enough method of graphic representation of the structure of statistical collections is a pie chart, as the whole idea is very clearly expressed in a circle, which represents the entire set. The relative magnitude of each value is represented as a circle sector, area of which corresponds to the contribution of this value in the sum of values. This type of diagramming is convenient to use when you need to show the value of each share in the total volume. Sectors may be depicted in a general circle or be separately arranged at a small distance from each other.
Pie charts are widely used in the reports, as they are visually appealing. The other side of the coin is, however, that pie charts are very simplified chart type that can not provide data well. Consider the possibility to use pie charts only after data processing, which results in a small number of data points.
For pie charts, each data group is displayed in a separate slice on the diagram. It is necessary for a pie chart to add at least one data field and one category field. If you add more than one data field to the pie chart, two data fields are displayed in the same graph.

Pic 1. Pie Chart Examples
While calculating the pie chart shares some values like empty, negative or zero are not taken into account. Therefore, these values are not displayed in the pie chart. If you want to visualize the values of these types in the diagram, you should choose a chart type that is different from a pie chart.
Unlike most other types of charts, the legend to the pie chart shows the individual data points instead of individual series.
At least two values are required for a pie chart to allow valid comparison between the two proportional shares.
If a pie chart contains only one color, make sure that you have a category field to group by. If the pie chart contains no categories, it performs statistical processing of the data fields values to get one a value for display.
To design pie and donut charts use ConceptDraw DIAGRAM diagramming and vector drawing software extended with Pie Charts solution from Graphs and Charts area of ConceptDraw DIAGRAM Solution Park.

Pic 2. Pie Chart in ConceptDraw STORE
The Pie Charts solution provides templates, samples and a library of vector stencils for quick and easy drawing pie and donut charts.
The shapes library Pie Charts contains ready-to-use predesigned pie and donut chart objects you can simply drop into your document, quickly set up data and obtain professional looking different types of pie and donut charts: percentage and absolute values pie charts, separated pie and exploded pie charts, pie charts with shifted slices, percentage and absolute values donut (doughnut, ring) charts, arrow ring charts.

Pic 3. Pie Chart Software
ConceptDraw DIAGRAM software with Pie Charts solution helps to create pie and donut charts for effective displaying proportions in statistics, business and mass media for composition comparison, i.e. for visualization of part percentage inside one total.

Pic 4. Pie Chart Library
Free Download Pie Chart Software and View All Examples
Using pie charts always leaves a free space on your page or slide. You can use this space to add illustrations or text labels provide your audience with additional information which may help your audience understand the subject.

Pic 5. Percentage pie chart. DA determinations
This example was created in ConceptDraw DIAGRAM using the Pie Charts Library from the Pie Charts Solution. An experienced user spent 5 minutes creating this sample.
TEN RELATED HOW TO's:
To create an Audit Process FlowChart you only need Conceptdaw Software.
Picture: Basic Audit Flowchart. Flowchart Examples
Related Solution:
This sample was created in ConceptDraw DIAGRAM diagramming and vector drawing software using the Line Graphs Solution from Graphs and Charts area of ConceptDraw Solution Park.
This sample shows the Line Chart of annual percentage change. The Line Chart allows you to clearly see the changes of data over the time.
Picture: Line Chart Template for Word
Related Solution:
This sample was created in ConceptDraw DIAGRAM diagramming and vector drawing software using the Bar Graphs Solution from Graphs and Charts area of ConceptDraw Solution Park. It is Bar Graphs example, Sales Growth example, Column Chart Example - Sales Report.
Picture: Sales Growth. Bar Graphs Example
Related Solution:
Using diagrams is the easiest way to explain the soccer formations. The Soccer solution from the Sport area of ConceptDraw Solution Park is designed as a tool that helps you produce the soccer diagrams in a few minutes. The predesigned samples of the Soccer solution for ConceptDraw DIAGRAM depict the most popular formation diagrams.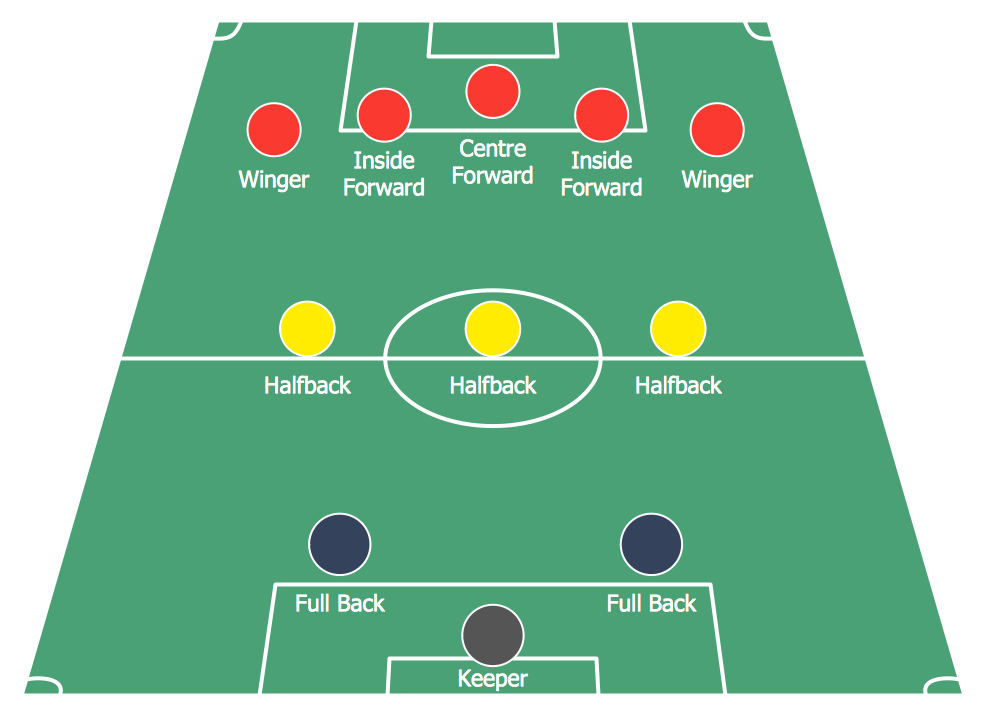
Picture: Soccer (Football) Formation
Related Solution:
The behavior of worker in organization is influences organizational effectiveness. A simple block diagram made with ConceptDraw Block diagrams solution can improve the understanding of expectations of workers regarding what they l contribute to organization and what they wait to obtain. Making block diagram depicting the individual behavior in organization is used in HR management to obtain an optimal and positive overall contribution to the organization.
The behavior of worker in organization is influences organizational effectiveness. A simple block diagram made with ConceptDraw Block diagrams solution can improve the understanding of expectations of workers regarding what they l contribute to organization and what they wait to obtain. Making block diagram depicting the individual behavior in organization is used in HR management to obtain an optimal and positive overall contribution to the organization.
Picture: Basic Diagramming
Related Solution:
This sample shows the Polar Graph. The Polar Graph is a graph in the polar coordinate system in which the each point on the plane is defined by two values - the polar angle and the polar radius. The certain equations have very complex graphs in the Cartesian coordinates, but the application of the polar coordinate system allows usually produce the simple Polar Graphs for these equations.
Picture: Polar Graph
PERT Chart Software - Activity Network and Project Evaluation and Review Technique, or PERT, charts are a way of documenting and analyzing the tasks in a project.
ConceptDraw DIAGRAM is a powerful diagramming and vector drawing software for designing professional looking PERT Charts quick and easy.
Picture: PERT Chart Software
Related Solution:
Process Flow Chart is a visual illustration of overall flow of activities in producing a product or service. How do you make a Process Flow Chart usually? Drawing process flow charts, diagrams and maps is quite complex and lengthy process, especially if you draw free-hand. But now thanks to the ConceptDraw DIAGRAM diagramming and vector drawing software extended with Flowcharts solution from the Diagrams area of ConceptDraw Solution Park this process became simple and fast. A confirmation of this can serve many Process Flow Chart examples included in Flowcharts solution.
Picture: Process Flow Chart Examples
Related Solution:
Create flowcharts, flow charts, and more with ConceptDraw flowchart software.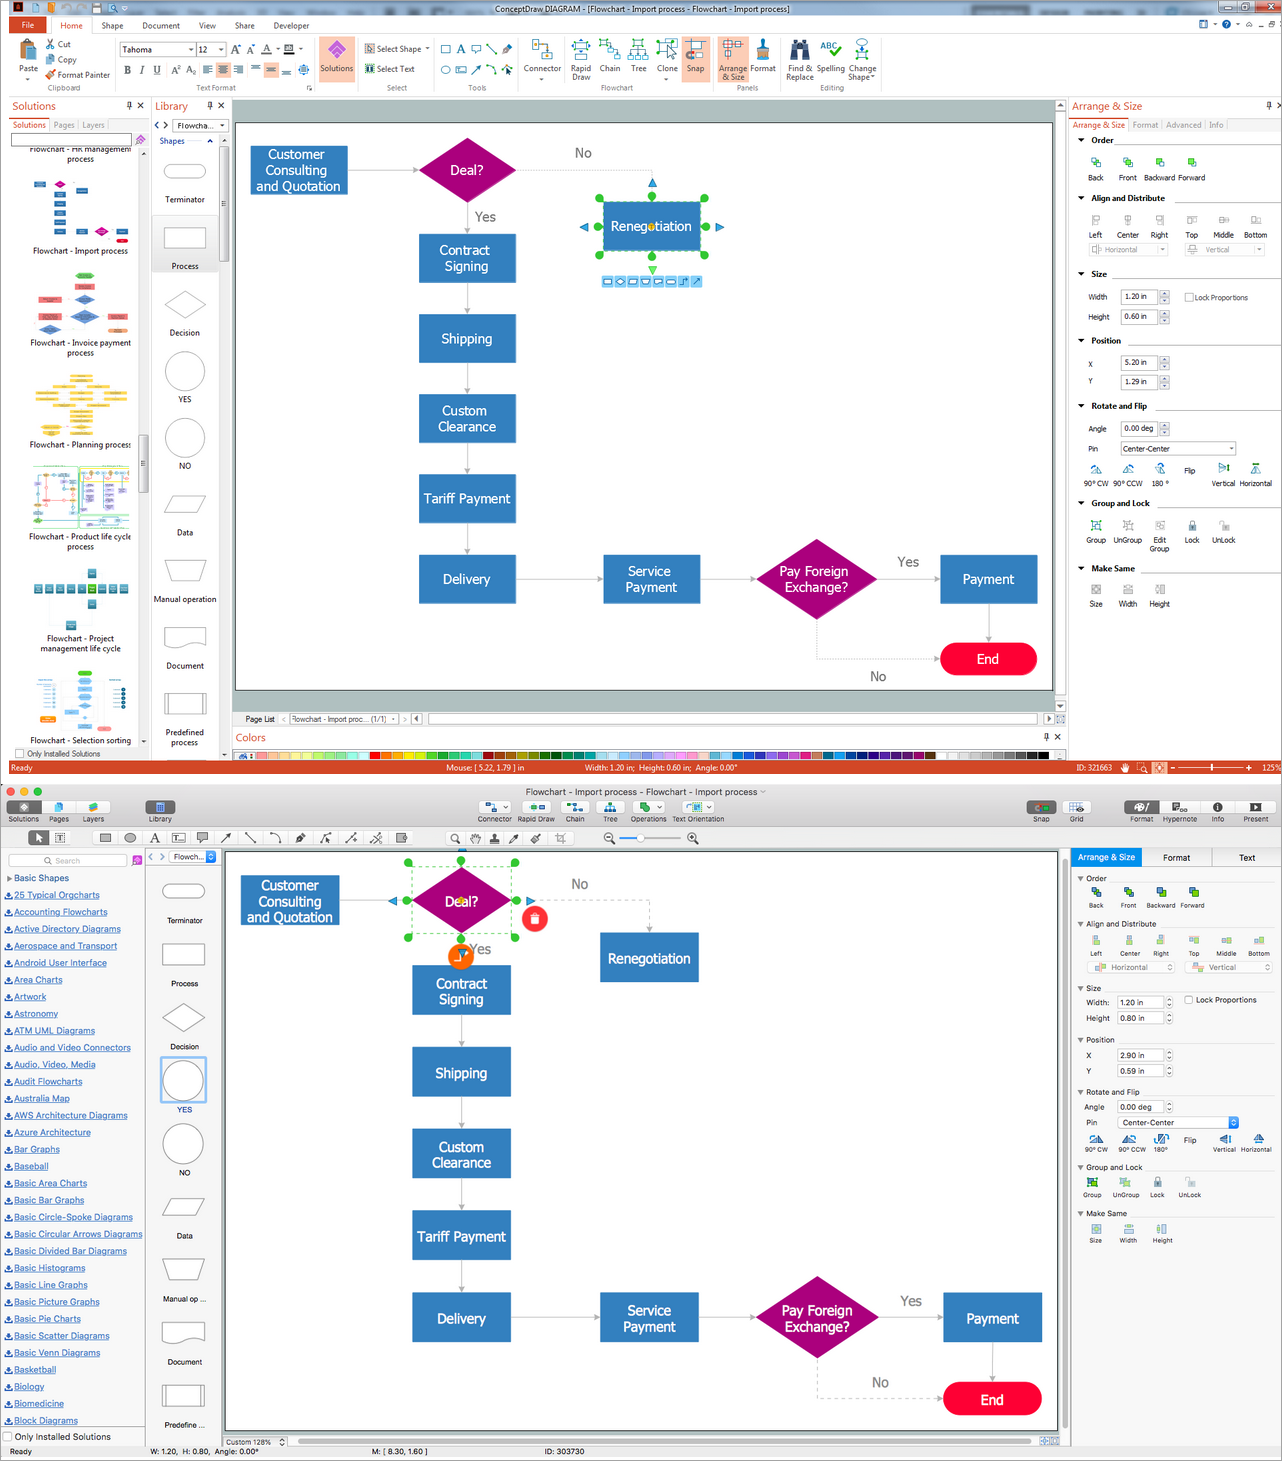
Picture: Basic Diagramming. Flowchart Software
Related Solution:
Still concerned about fire safety in your establishment? Be sure that all the necessary elements like registers, drills and diffusers are present on your plan. Otherwise, you have to put them on it immediately.
Here you can see the Registers, Drills and Diffusers library that contains vector graphical objects depicting various, drills, diffusers and registers that are used in HVAC systems and reflected ceilings. ConceptDraw had solutions designed to support both. You can use it to create effortlessly Reflected Ceiling plans, HVAC plans and other interior design and building plans related issues. ConceptDraw DIAGRAM provides a complete set of tools for creating graphical documents in compliance with all requirements of modern design of technical documentation.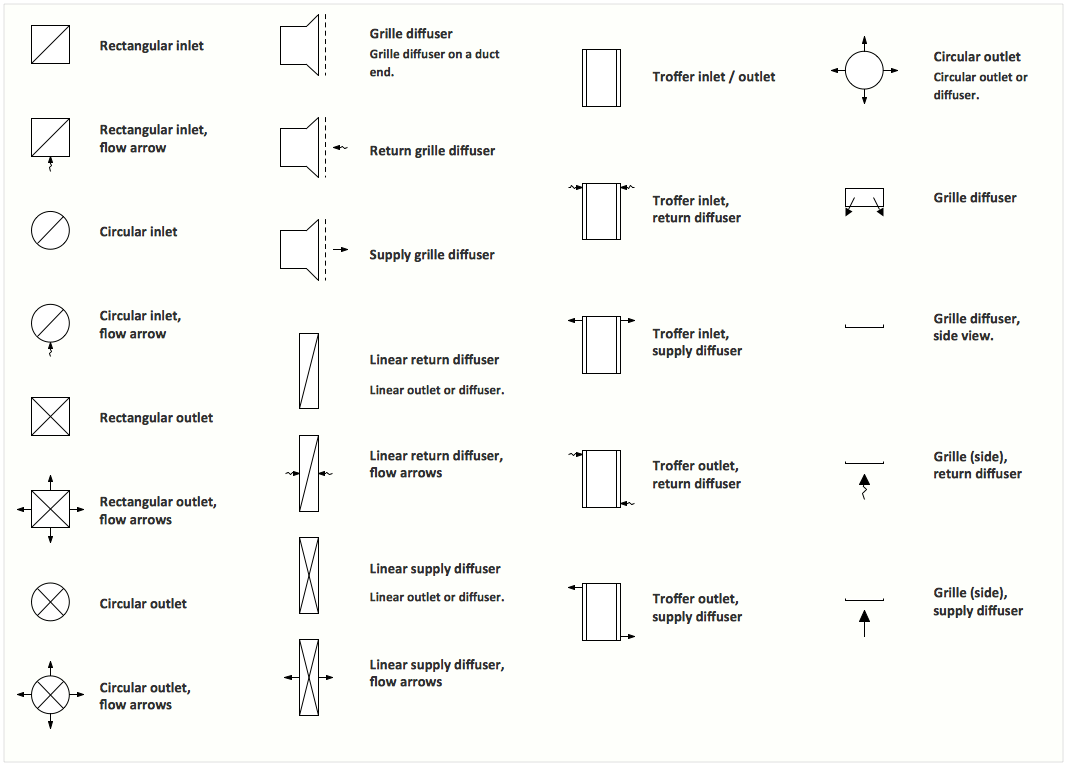
Picture: Interior Design. Registers, Drills and Diffusers — Design Elements
Related Solution: