PERT Chart Software

ConceptDraw DIAGRAM is a powerful diagramming and vector drawing software for designing professional looking PERT Charts quick and easy.
PERT Chart
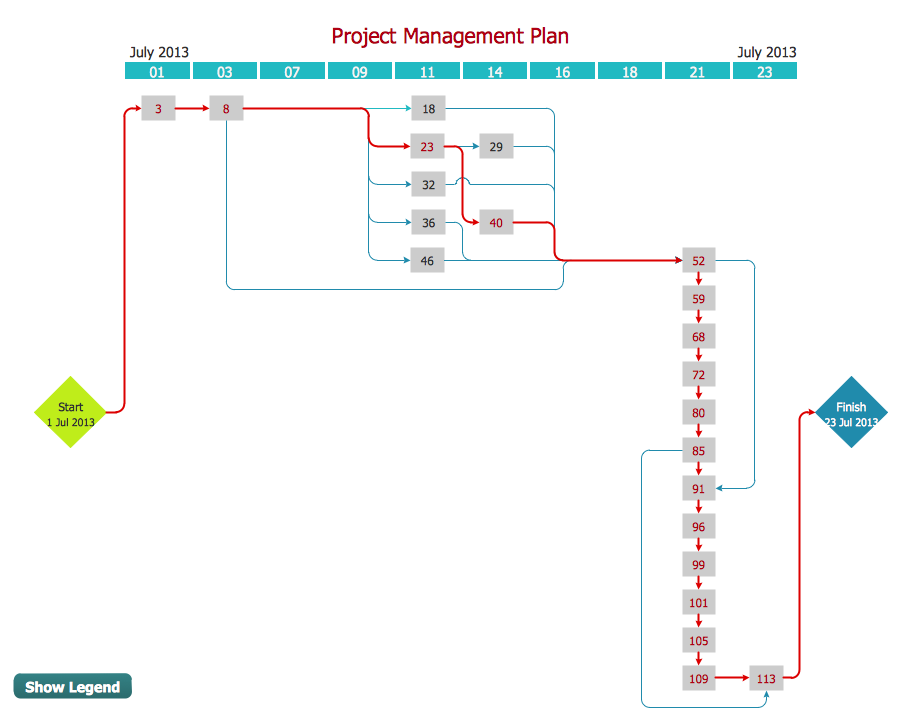
"A project network is a graph (flow chart) depicting the sequence in which a project's terminal elements are to be completed by showing terminal elements and their dependencies.
... the project network shows the "before-after" relations.
The most popular form of project network is activity on node, the other one is activity on arrow.
The condition for a valid project network is that it doesn't contain any circular references." [Project network. Wikipedia]
The PERT chart example "Project management plan" was created using the ConceptDraw PRO diagramming and vector drawing software extended with the solution "Seven Management and Planning Tools" from the Management area of ConceptDraw Solution Park.
PERT

Legend

Activity Network Diagram Method

This sample shows the PERT (Program Evaluation Review Technique) chart of the request on proposal. A request for proposal (RFP) is a request of the company or the organization to potential suppliers to submit the business proposals for service or goods that it is interested to purchase. The RFP is represented on the initial procurement stage and allows to define the risks and benefits.
 Seven Management and Planning Tools
Seven Management and Planning Tools solution extends ConceptDraw DIAGRAM and ConceptDraw MINDMAP with features, templates, samples and libraries of vector stencils for drawing management mind maps and diagrams.
Circles Venn Diagram

3 Circle Venn Diagram. Venn Diagram Example

Venn Diagrams visualize all possible logical intersections between several sets and are widely used in mathematics, logic, statistics, marketing, sociology, etc.
Venn Diagram Template for Word

Cylinder Venn Diagram

3 Circle Venn. Venn Diagram Example

ConceptDraw DIAGRAM

Multi Layer Venn Diagram. Venn Diagram Example

Venn Diagram Examples for Problem Solving. Environmental Social Science. Human Sustainability Confluence

Create your Venn diagrams for problem solving in environmental social science using the ConceptDraw DIAGRAM diagramming and vector drawing software extended with the Venn Diagrams solution from the area "Diagrams" of ConceptDraw Solution Park.
Example of DFD for Online Store (Data Flow Diagram)

Example of DFD for Online Store shows the Data Flow Diagram for online store and interactions between the Visitors, Customers and Sellers, as well as Website Information and User databases.

Venn Diagram Examples for Problem Solving. Venn Diagram as a Truth Table

- Program Evaluation and Review Technique ( PERT) with ...
- PERT chart - Template | Program Evaluation and Review Technique ...
- Program Evaluation and Review Technique ( PERT) with ...
- PERT Chart | Program Evaluation and Review Technique ( PERT ...
- CORRECTIVE ACTIONS PLANNING. PERT Chart | Program ...
- Construction Project Chart Examples | Program Evaluation and ...
- PERT chart - Project management plan | Program Evaluation and ...
- Seven Management and Planning Tools | Program Evaluation and ...
- Activity Network ( PERT ) Chart | Program Evaluation and Review ...
- Activity Network ( PERT ) Chart | Program Evaluation and Review ...
- PM Easy | Program Evaluation and Review Technique ( PERT) with ...
- CORRECTIVE ACTIONS PLANNING PERT Chart | Program ...
- PERT Chart Software | Program Evaluation and Review Technique ...
- Activity Network ( PERT ) Chart | How To Create a PERT Chart ...
- How To Create a PERT Chart | Activity Network Diagram Method ...
- Process Flowchart | Program Evaluation and Review Technique ...
- Seven Management and Planning Tools | PERT chart - Sale ...
- Seven Management and Planning Tools | Activity Network ( PERT ...
- Activity Network ( PERT ) Chart | Activity Network Diagram Method ...
- How To Create a PERT Chart | Program Evaluation and Review ...
- ERD | Entity Relationship Diagrams, ERD Software for Mac and Win
- Flowchart | Basic Flowchart Symbols and Meaning
- Flowchart | Flowchart Design - Symbols, Shapes, Stencils and Icons
- Flowchart | Flow Chart Symbols
- Electrical | Electrical Drawing - Wiring and Circuits Schematics
- Flowchart | Common Flowchart Symbols
- Flowchart | Common Flowchart Symbols