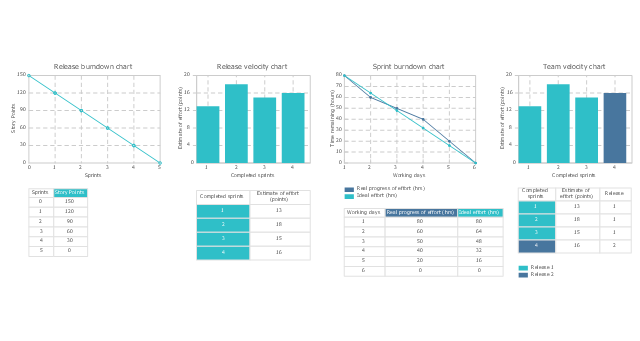
The vector stencils library "Scrum charts" contains 4 templates: release burndown chart, sprint burndown chart, release velocity chart and team velocity chart. Use it to design your agile software development charts and infographics.
"A burn down chart is a graphical representation of work left to do versus time. The outstanding work (or backlog) is often on the vertical axis, with time along the horizontal. That is, it is a run chart of outstanding work. It is useful for predicting when all of the work will be completed. It is often used in agile software development methodologies such as Scrum. However, burn down charts can be applied to any project containing measurable progress over time.
Outstanding work can be represented in terms of either time or story points." [Burn down chart. Wikipedia]
The burn down and velocity charts sample "Design elements - Scrum charts" is included in the Scrum solution from the Project Management area of ConceptDraw Solution Park.
Burn down and velocity charts
HelpDesk
How to Create a Release Burn-Down Chart Using ConceptDraw PRO

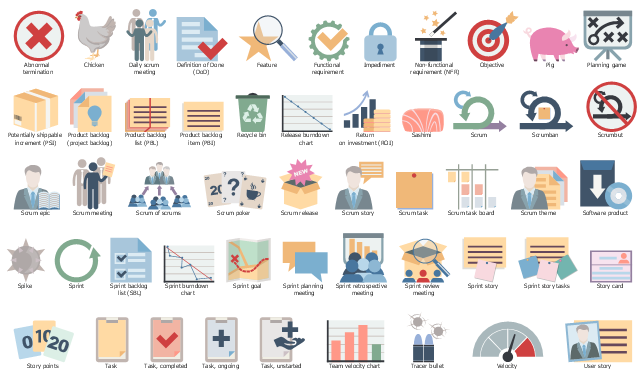
The vector stencils library "Scrum artifacts" contains 52 icons.
Use this clipart set to design your agile software development diagrams and infographics with ConceptDraw PRO software.
"Product backlog
The product backlog comprises an ordered list of requirements that a scrum team maintains for a product. It consists of features, bug fixes, non-functional requirements, etc.—whatever must be done to successfully deliver a viable product. The product owner orders the product backlog items (PBIs) based on considerations such as risk, business value, dependencies, and date needed. ...
Sprint backlog
The sprint backlog is the list of work the development team must address during the next sprint. The list is derived by the scrum team selecting product backlog items from the top of the product backlog until the development team feels it has enough work to fill the sprint. This is done by the development team asking "Can we also do this?" and adding product backlog items to the sprint backlog. The development team should keep in mind its past performance assessing its capacity for the new sprint, and use this as a guide line of how much "effort" they can complete.
The product backlog items may be broken down into tasks by the development team. Tasks on the sprint backlog are never assigned; rather, tasks are signed up for by the team members as needed according to the set priority and the development team member skills. This promotes self-organization of the development team, and developer buy-in. ...
Sprint burn-down chart
The sprint burndown chart is a public displayed chart showing remaining work in the sprint backlog. Updated every day, it gives a simple view of the sprint progress. ...
Release burn-down chart
The release burndown chart is the way for the team to track progress and provide visibility. The release burndown chart is updated at the end of each sprint by the scrum master. The horizontal axis of the release burndown chart shows the sprints; the vertical axis shows the amount of work remaining at the start of each sprint." [Scrum (software development). Wikipedia]
The clip art sample "Design elements - Scrum artifacts" is included in the Scrum solution from the Project Management area of ConceptDraw Solution Park.
Clipart set
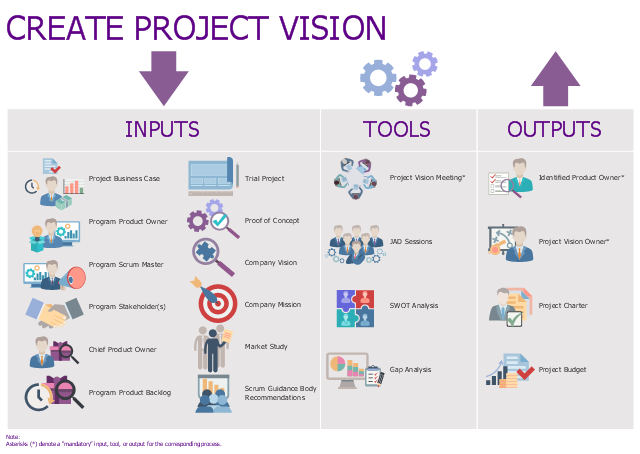
This infographic example was designed on the base of Fig. 8-3 "Create Project Vision — Inputs, Tools, and Outputs " on the page 137 of the "A Guide to the SCRUM BODY OF KNOWLEDGE (SBOK™ Guide) 2016 Edition".
" Create Project Vision — In this process, the Project Business Case is reviewed to create a Project Vision Statement that will serve as the inspiration and provide focus for the entire project. The Product Owner is identified in this process."
[scrumstudy.com/ SBOK/ SCRUMstudy-SBOK-Guide-2013.pdf]
This example of agile software development infographic was created using the ConceptDraw PRO software extended with the Scrum solution from the Project Management area of ConceptDraw Solution Park.
Infographic
Used Solutions
 Scrum Workflow
The Scrum Workflow Solution extends the capabilities of ConceptDraw PRO 10 with a large collection of professionally-designed samples and a selection of ready-to-use scrum design elements: scrum diagrams and arrows, scrum icons of people, artifacts, workflow, workspace and other colorful scrum clipart, and also scrum charts.
This work flow chart sample was redesigned from the picture "Weather Forecast" from the article "Simulation Workflows".
[iaas.uni-stuttgart.de/ forschung/ projects/ simtech/ sim-workflows.php]
"(1) The weather is predicted for a particular geological area. Hence, the workflow is fed with a model of the geophysical environment of ground, air and water for a requested area.
(2) Over a specified period of time (e.g. 6 hours) several different variables are measured and observed. Ground stations, ships, airplanes, weather balloons, satellites and buoys measure the air pressure, air/ water temperature, wind velocity, air humidity, vertical temperature profiles, cloud velocity, rain fall, and more.
(3) This data needs to be collected from the different sources and stored for later access.
(4) The collected data is analyzed and transformed into a common format (e.g. Fahrenheit to Celsius scale). The normalized values are used to create the current state of the atmosphere.
(5) Then, a numerical weather forecast is made based on mathematical-physical models (e.g. GFS - Global Forecast System, UKMO - United Kingdom MOdel, GME - global model of Deutscher Wetterdienst). The environmental area needs to be discretized beforehand using grid cells. The physical parameters measured in Step 2 are exposed in 3D space as timely function. This leads to a system of partial differential equations reflecting the physical relations that is solved numerically.
(6) The results of the numerical models are complemented with a statistical interpretation (e.g. with MOS - Model-Output-Statistics). That means the forecast result of the numerical models is compared to statistical weather data. Known forecast failures are corrected.
(7) The numerical post-processing is done with DMO (Direct Model Output): the numerical results are interpolated for specific geological locations.
(8) Additionally, a statistical post-processing step removes failures of measuring devices (e.g. using KALMAN filters).
(9) The statistical interpretation and the numerical results are then observed and interpreted by meteorologists based on their subjective experiences.
(10) Finally, the weather forecast is visualized and presented to interested people." [iaas.uni-stuttgart.de/ forschung/ projects/ simtech/ sim-workflows.php]
The example "Workflow diagram - Weather forecast" was drawn using the ConceptDraw PRO diagramming and vector drawing software extended with the Workflow Diagrams solution from the Business Processes area of ConceptDraw Solution Park.
Work flow chart

- Velocity Chart
- Scrum Workflow Solution for ConceptDraw PRO v10
- How to Create a Release Burn-Down Chart Using ConceptDraw PRO
- How to Create a Release Burn-Down Chart Using ConceptDraw ...
- PM Agile | Scrum Workflow | Task Board | Team Velocity Agile ...
- How to Draw an Area Chart in ConceptDraw PRO | How to Create a ...
- Construction Project Chart Examples
- How to Create a Release Burn-Down Chart Using ConceptDraw PRO
- Flow chart Example. Warehouse Flowchart | How to Create a ...
- PM Agile | How to Create a Release Burn-Down Chart Using ...
- ERD | Entity Relationship Diagrams, ERD Software for Mac and Win
- Flowchart | Basic Flowchart Symbols and Meaning
- Flowchart | Flowchart Design - Symbols, Shapes, Stencils and Icons
- Flowchart | Flow Chart Symbols
- Electrical | Electrical Drawing - Wiring and Circuits Schematics
- Flowchart | Common Flowchart Symbols
- Flowchart | Common Flowchart Symbols