HelpDesk
How to Create a SIPOC Diagram
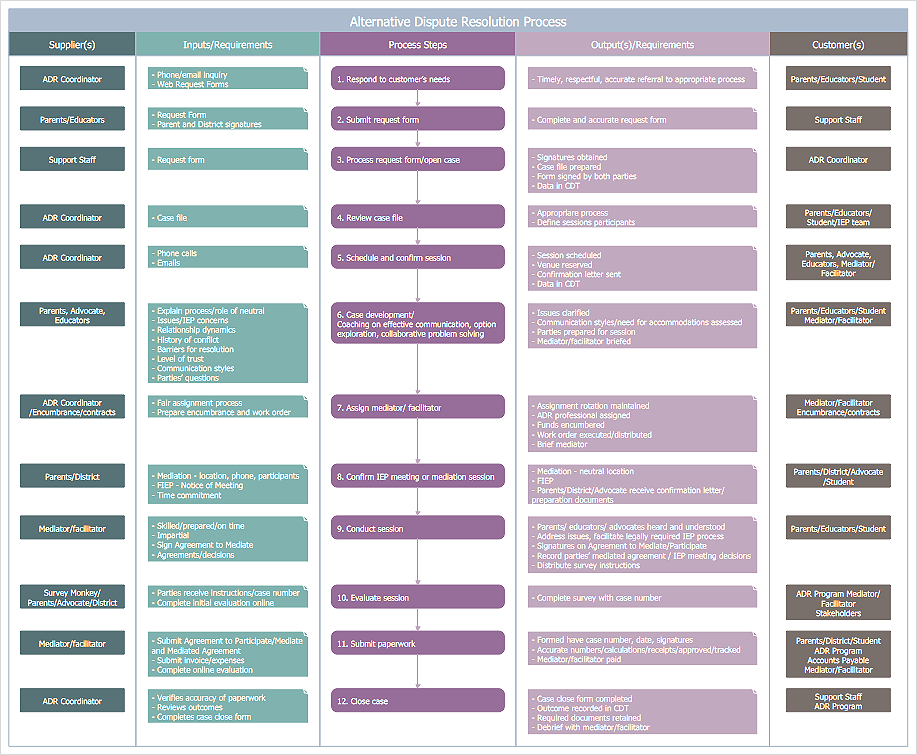
 Business Process Mapping
The Business Process Mapping solution for ConceptDraw DIAGRAM is for users involved in process mapping and creating SIPOC diagrams.
Swim Lane Diagrams

Basic Flowchart Symbols and Meaning


UML Flowchart Symbols

The Rapid UML solution for ConceptDraw DIAGRAM software offers diversity of UML flowchart symbols for drawing all types of UML diagrams.
Accounting Flowchart Symbols

Process Flowchart


Data Flow Diagram Symbols. DFD Library

Cross-Functional Flowchart

Use cross-functional flowcharts to show the relationship between a business process and the functional units (such as departments) responsible for that process. To create it use the best flowchart maker of ConceptDraw DIAGRAM.

Sales Process Flowchart Symbols

- Example Of Flowchart That Has Input Process Output And Discussion
- Input Output Diagram Template
- Input Output Flow Chart Template
- How To Draw Input Output Diagram
- Input Output Process Diagram
- Suppliers Inputs Process Outputs Customers
- Input Output Chart Process Flow
- Draw Tha Input Output Process Diagram
- Fruit Chart Example Input Process Output Making Flow Chart
- Draw Input Output Process Diagram
- ERD | Entity Relationship Diagrams, ERD Software for Mac and Win
- Flowchart | Basic Flowchart Symbols and Meaning
- Flowchart | Flowchart Design - Symbols, Shapes, Stencils and Icons
- Flowchart | Flow Chart Symbols
- Electrical | Electrical Drawing - Wiring and Circuits Schematics
- Flowchart | Common Flowchart Symbols
- Flowchart | Common Flowchart Symbols