The vector stencils library "Picture Graphs" contains 4 image chart templates. Use it to design your pictorial bar charts in ConceptDraw PRO diagramming and vector drawing software.
"Pictorial bar graph.
Sometimes reffered to as a pictographs. A pictorial bar graph is a graph in which the rectangular bars have been filled with pictures, sketches, icons, etc. or where pictures, sketches, icons, etc. have been substituted for the rectangular bars. In both variations, one or more symbols might be used in each bar. The two major reasons for using pictorial graphs are to make the graph more appealing visually and to facilitate better communications." [Information Graphics: A Comprehensive Illustrated Reference. R. L. Harris. 1999. p.41]
The chart templates example "Design elements - Picture graphs" is included in the Basic Picture Graphs solution from the Graphs and Charts area of ConceptDraw Solution Park.
Pictorial chart templates

Picture Graph

This picture bar graph sample shows regional population growth from 2010 to 2016. It was designed using data from the Wikipedia article List of continents by population.
[en.wikipedia.org/ wiki/ List_ of_ continents_ by_ population]
"Population geography is a division of human geography. It is the study of the ways in which spatial variations in the distribution, composition, migration, and growth of populations are related to the nature of places. Population geography involves demography in a geographical perspective. It focuses on the characteristics of population distributions that change in a spatial context." [Population geography. Wikipedia]
The pictorial chart example "Regional population growth from 2010 to 2016" was created using the ConceptDraw PRO diagramming and vector drawing software extended with the Picture Graphs solution from the Graphs and Charts area of ConceptDraw Solution Park.
Image chart

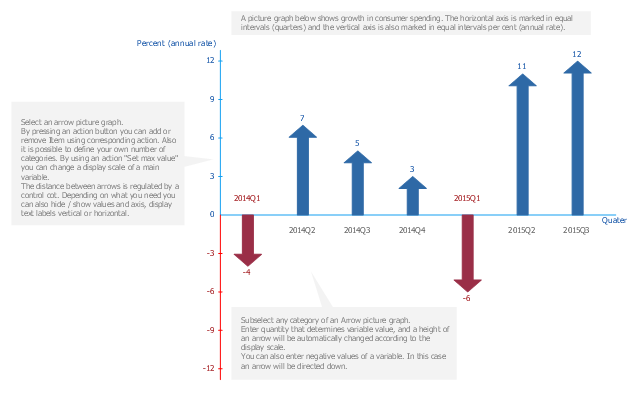
A picture chart (image chart, pictorial graph) is the type of a bar graph visualizing numarical data using symbols and pictograms.
In the field of economics and finance use a picture graph with columns in the form of coins. For population comparison statistics use a chart with columns in the form of manikins. To show data increase or decrease use arrows bar charts.
The arrow chart template "Picture graph" for the ConceptDraw PRO diagramming and vector drawing software is included in the Basic Picture Graphs solution from the Graphs and Charts area of ConceptDraw Solution Park.
Arrows bar graph template
 Basic Picture Graphs
This solution extends the capabilities of ConceptDraw DIAGRAM (or later) with templates, samples and a library of vector stencils for drawing Picture Graphs.
 Picture Graphs
Typically, a Picture Graph has very broad usage. They many times used successfully in marketing, management, and manufacturing. The Picture Graphs Solution extends the capabilities of ConceptDraw DIAGRAM with templates, samples, and a library of professionally developed vector stencils for designing Picture Graphs.
What Is a Picture Graph?

This pictorial chart sample shows the population growth by continent in 2010-2013.
"Population growth' refers to the growth in human populations. Global population growth is around 80 million annually, or 1.2% p.a. The global population has grown from 1 billion in 1800 to 7 billion in 2012. It is expected to keep growing to reach 11 billion by the end of the century. Most of the growth occurs in the nations with the most poverty, showing the direct link between high population growth and low standards of living. The nations with high standards of living generally have low or zero rates of population growth. Australia's population growth is around 400,000 annually, or 1.8% p.a., which is nearly double the global average. It is caused mainly by very high immigration of around 200,000 p.a., the highest immigration rate in the world. Australia remains the only nation in the world with both high population growth and high standards of living." [Population growth. Wikipedia]
The image chart example "Population growth by continent, 2010 - 2013" was created using the ConceptDraw PRO diagramming and vector drawing software extended with the Basic Picture Graphs solution from the Graphs and Charts area of ConceptDraw Solution Park.
Image chart

This picture bar graph sample shows the computer and Internet use at home from 1984 to 2014. It was designed using data from website of the United States Census Bureau (USCB).
[census.gov/ content/ dam/ Census/ library/ visualizations/ 2016/ comm/ digital_ nation.png]
"Home automation is the residential extension of building automation and involves the control and automation of lighting, heating, ventilation, air conditioning (HVAC), appliances, and security. Modern systems generally consist of switches and sensors connected to a central hub sometimes called a "gateway" from which the system is controlled with a user interface that is interacted either with a wall-mounted terminal, mobile phone software, tablet computer or a web interface." [Home automation. Wikipedia]
The pictorial chart example "Computer and Internet use at home over time" was created using the ConceptDraw PRO diagramming and vector drawing software extended with the Picture Graphs solution from the Graphs and Charts area of ConceptDraw Solution Park.
Image chart

Pictures of Vegetables

ConceptDraw DIAGRAM diagramming and vector drawing software extended with Food Court solution from the Food and Beverage area of ConceptDraw Solution Park is perfect food pictures design software.
The vector stencils library "Picture Graphs" contains 35 templates of picture bar graphs for visual data comparison and time series.
Drag a template from the library to your document, set bars number, type category labels, select bars and enter your data.
Use these shapes to draw your pictorial bar charts in the ConceptDraw PRO diagramming and vector drawing software.
The vector stencils library "Picture Graphs" is included in the Picture Graphs solution from the Graphs and Charts area of ConceptDraw Solution Park.
Arrow
Water drop

Food

Grain

Agriculture

Medicines

Houses

Buildings

Money bags

Oil barrels

Natural gas

Electrical power

Nuclear power

Mechanical engineering

Chemical industry

Mining

Gold bars

Coins

Person

Men, women and children

Man

Woman

Child

Milk

Meat

Fruits

Vegetables

Computer

Mobile phone

Airliner

Car

Bus

Truck

Train

Cargo ship

The vector stencils library "Picture bar graphs" contains 35 templates of pictorial charts. Use it for visualization of data comparison and time series with ConceptDraw PRO diagramming and vector drawing software.
"Pictorial bar graph.
Sometimes reffered to as a pictographs. A pictorial bar graph is a graph in which the rectangular bars have been filled with pictures, sketches, icons, etc. or where pictures, sketches, icons, etc. have been substituted for the rectangular bars. In both variations, one or more symbols might be used in each bar. The two major reasons for using pictorial graphs are to make the graph more appealing visually and to facilitate better communications." [Information Graphics: A Comprehensive Illustrated Reference. R. L. Harris. 1999. p.41]
The pictorial charts example "Design elements - Picture bar graphs" is included in the Picture Graphs solution from the Graphs and Charts area of ConceptDraw Solution Park.
Templates

Export from ConceptDraw DIAGRAM Document to a Graphic File

ConceptDraw DIAGRAM can save your drawings and diagrams in a number of highly useful formats, including graphic files. You can save your drawing as a.PNG,.JPG, or other graphic format file.

Financial Comparison Chart

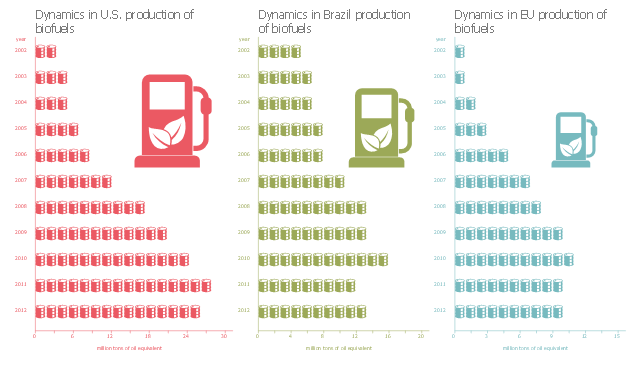
This picture bar graph sample shows biofuels production dynamics in U.S., Brazil and EU from 2002 to 2012. It was designed on the base of the Wikimedia Commons file: Production of biofuels.jpg.
[commons.wikimedia.org/ wiki/ File:Production_ of_ biofuels.jpg]
This file is made available under the Creative Commons CC0 1.0 Universal Public Domain Dedication. [creativecommons.org/ publicdomain/ zero/ 1.0/ deed.en]
"A biofuel is a fuel that is produced through contemporary biological processes, such as agriculture and anaerobic digestion, rather than a fuel produced by geological processes such as those involved in the formation of fossil fuels, such as coal and petroleum, from prehistoric biological matter. Biofuels can be derived directly from plants, or indirectly from agricultural, commercial, domestic, and/ or industrial wastes. Renewable biofuels generally involve contemporary carbon fixation, such as those that occur in plants or microalgae through the process of photosynthesis. Other renewable biofuels are made through the use or conversion of biomass (referring to recently living organisms, most often referring to plants or plant-derived materials). This biomass can be converted to convenient energy-containing substances in three different ways: thermal conversion, chemical conversion, and biochemical conversion. This biomass conversion can result in fuel in solid, liquid, or gas form. This new biomass can also be used directly for biofuels." [Biofuel. Wikipedia]
The pictorial chart example "Production of biofuels" was created using the ConceptDraw PRO diagramming and vector drawing software extended with the Picture Graphs solution from the Graphs and Charts area of ConceptDraw Solution Park.
Image chart
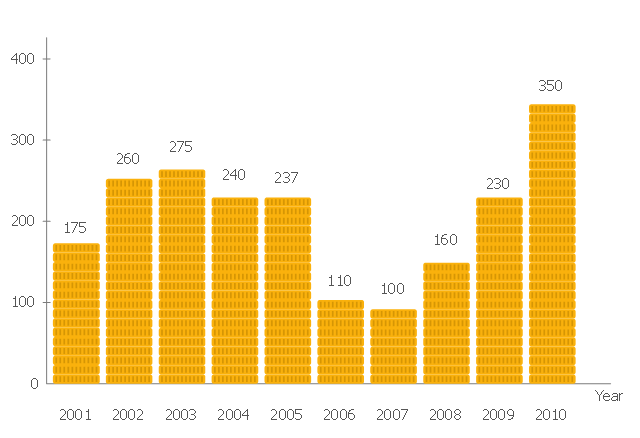
This image graph sample shows the total financing of the Philippines from 2001-2010. This pictorial bar chart was designed on the base of the Wikimedia Commons file: Financing-Total.png. [commons.wikimedia.org/ wiki/ File:Financing-Total.png]
This file is licensed under the Creative Commons Attribution-Share Alike 3.0 Unported license. [creativecommons.org/ licenses/ by-sa/ 3.0/ deed.en]
"The Economy of the Philippines is the 40th largest in the world, according to 2012 International Monetary Fund statistics, and is also one of the emerging markets in the world. The Philippines is considered as a newly industrialized country, which has been transitioning from being one based on agriculture to one based more on services and manufacturing. According to the World Bank ICP 2011, the estimated 2011 GDP (purchasing power parity) was $543.7 billion." [Economy of the Philippines. Wikipedia]
The image chart example "The total financing of the Philippines from 2001-2010" was created using the ConceptDraw PRO diagramming and vector drawing software extended with the Marketing Diagrams solution from the Marketing area of ConceptDraw Solution Park.
Marketing graph
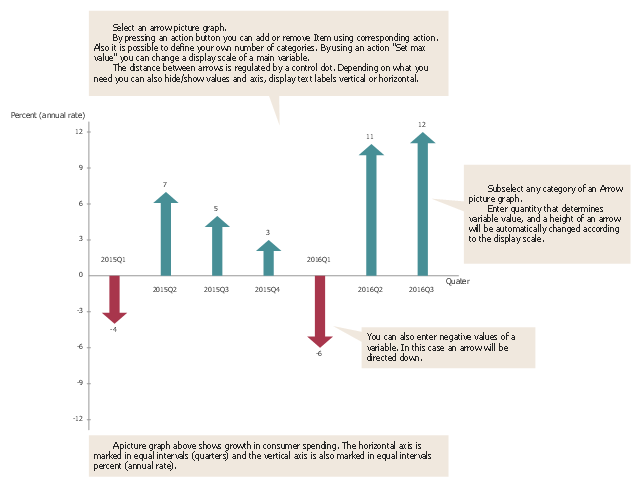
A picture chart (image chart, pictorial graph) is the type of a bar graph visualizing numarical data using symbols and pictograms.
In the field of economics and finance use a picture graph with columns in the form of coins. For population comparison statistics use a chart with columns in the form of manikins. To show data increase or decrease use arrows bar charts.
The picture graph template for the ConceptDraw PRO diagramming and vector drawing software is included in the Picture Graphs solution from the Statistical Charts and Diagrams area of ConceptDraw Solution Park.
Arrows bar graph template
Sales Growth. Bar Graphs Example

 Line Graphs
How to draw a Line Graph with ease? The Line Graphs solution extends the capabilities of ConceptDraw DIAGRAM with professionally designed templates, samples, and a library of vector stencils for drawing perfect Line Graphs.
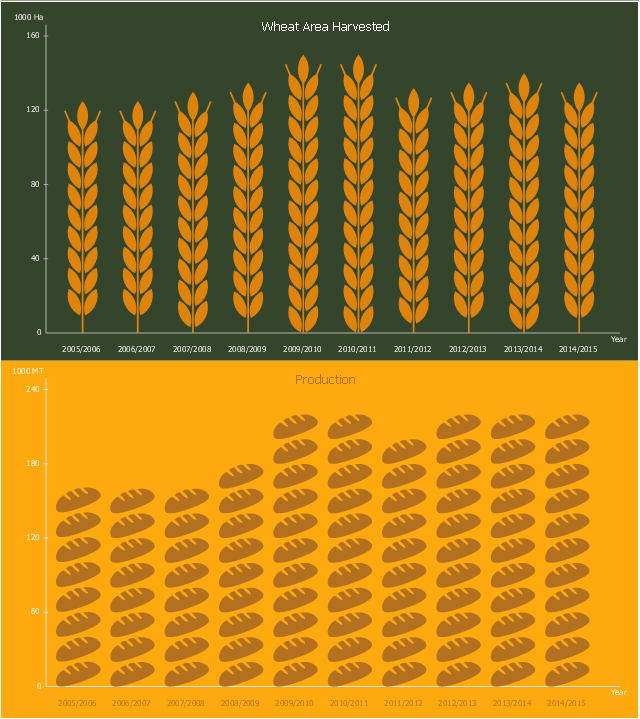
This picture bar graph sample shows wheat area harvested and production in Peru from 2006 to 2015. It was designed using data from website of the Foreign Agriculfural Service, the U.S. Department of Agriculture (USDA).
"Wheat remains a minor crop in Peru with most of the production concentrated in the temperate, southern highlands. Grown at 2,800 to 3,500 meters above sea level, production remains limited by geography as well as current economics. The Peruvian farmer cultivates only about two hectares of wheat, on average. While wheat production has increased slightly since 1994, it has remained relatively stable for the last six years at around 225,000 MT."
[fas.usda.gov/ data/ peru-wheat-production-limited-competition-corn-and-quinoa]
The pictorial chart example "Peru wheat area and production" was created using the ConceptDraw PRO diagramming and vector drawing software extended with the Picture Graphs solution from the Graphs and Charts area of ConceptDraw Solution Park.
Image chart
- Picture Graphs
- Picture Graphs
- A Picture Of A Block Graph
- Picture Graphs
- Picture Graphs | Competitor Analysis | What Is a Picture Graph ...
- Chart Templates | Pie Charts | Basic Line Graphs | Increase The ...
- Basic Diagramming | Picture Graphs | How to Draw a Line Graph ...
- Design elements - Picture graphs | Picture graph - Template | Picture ...
- Design elements - Picture bar graphs | Picture graphs - Vector ...
- Rainfall Bar Chart | Chart Maker for Presentations | Picture Graph ...
- Image chart - The total financing of the Philippines from 2001-2010 ...
- Gantt chart examples | Chart Maker for Presentations | What Is a ...
- Picture Graphs | Bar Diagram Math | Beauty of Event-driven Process ...
- Design elements - Picture bar graphs | Picture Graph Or Pictograph
- Bar Graphs | Sales Growth. Bar Graphs Example | Picture Graphs ...
- Picture Graphs | Infographic Maker | Geo Map - Oceania | Image On ...
- Line Graph | Population growth by continent | Line Chart Examples ...
- Picture Graph | Pictures of Graphs | Sales Growth. Bar Graphs ...
- TQM Diagram Tool | Picture Graphs | Seven Basic Tools of Quality ...
- Pictures of Graphs | Picture Graph | Line Graph | Images Of Pie ...
- ERD | Entity Relationship Diagrams, ERD Software for Mac and Win
- Flowchart | Basic Flowchart Symbols and Meaning
- Flowchart | Flowchart Design - Symbols, Shapes, Stencils and Icons
- Flowchart | Flow Chart Symbols
- Electrical | Electrical Drawing - Wiring and Circuits Schematics
- Flowchart | Common Flowchart Symbols
- Flowchart | Common Flowchart Symbols