What is Gantt Chart (historical reference)

How To Use Skype for Business

HelpDesk
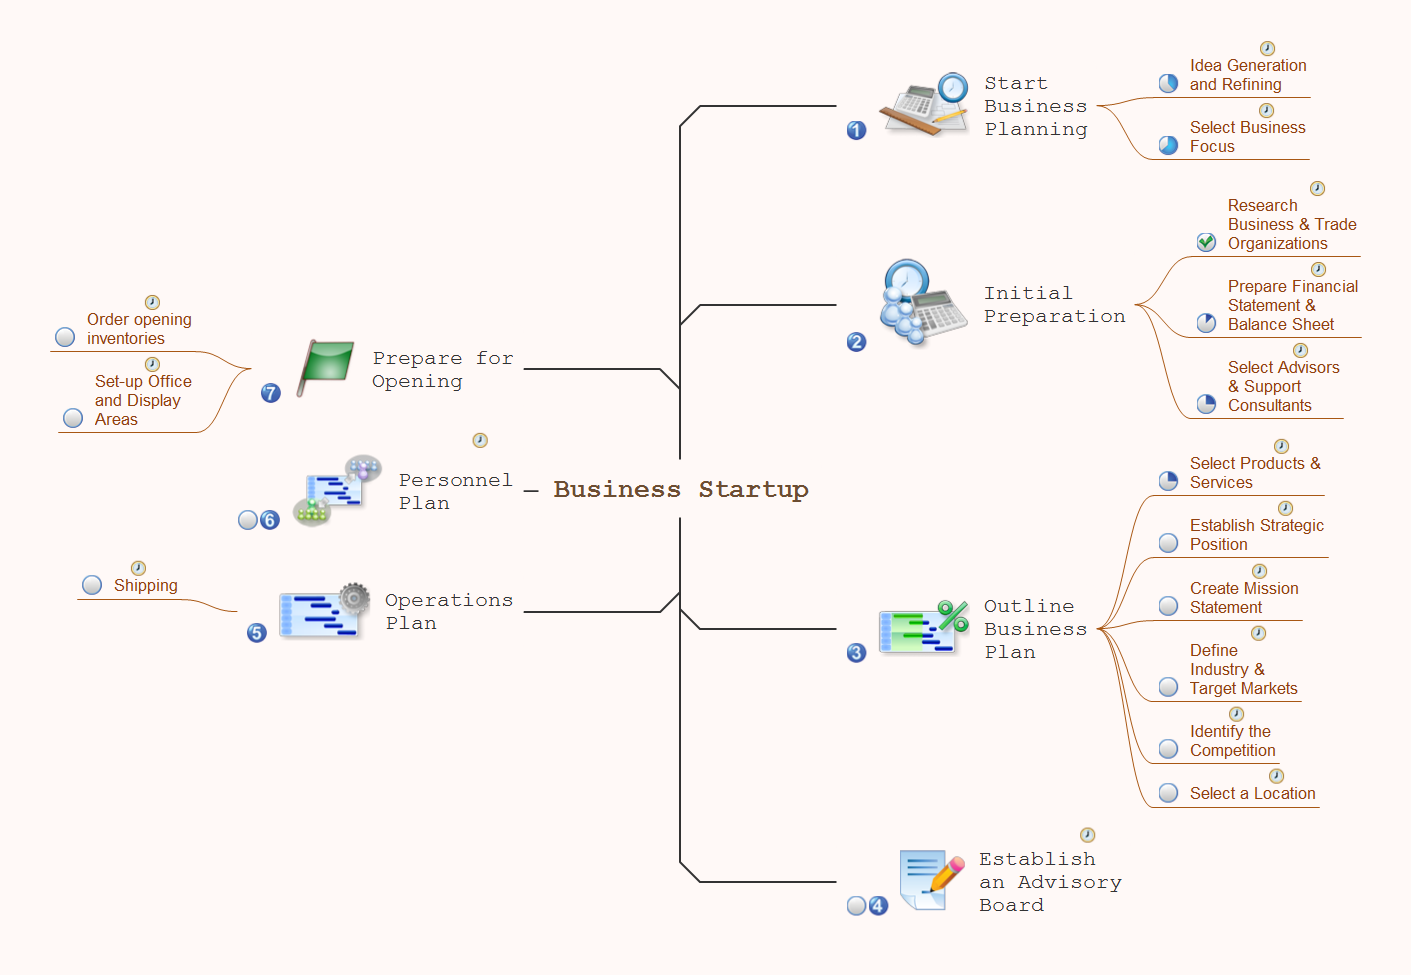
How to Add a Mind Map into a Given Notebook in Your Evernote Storage

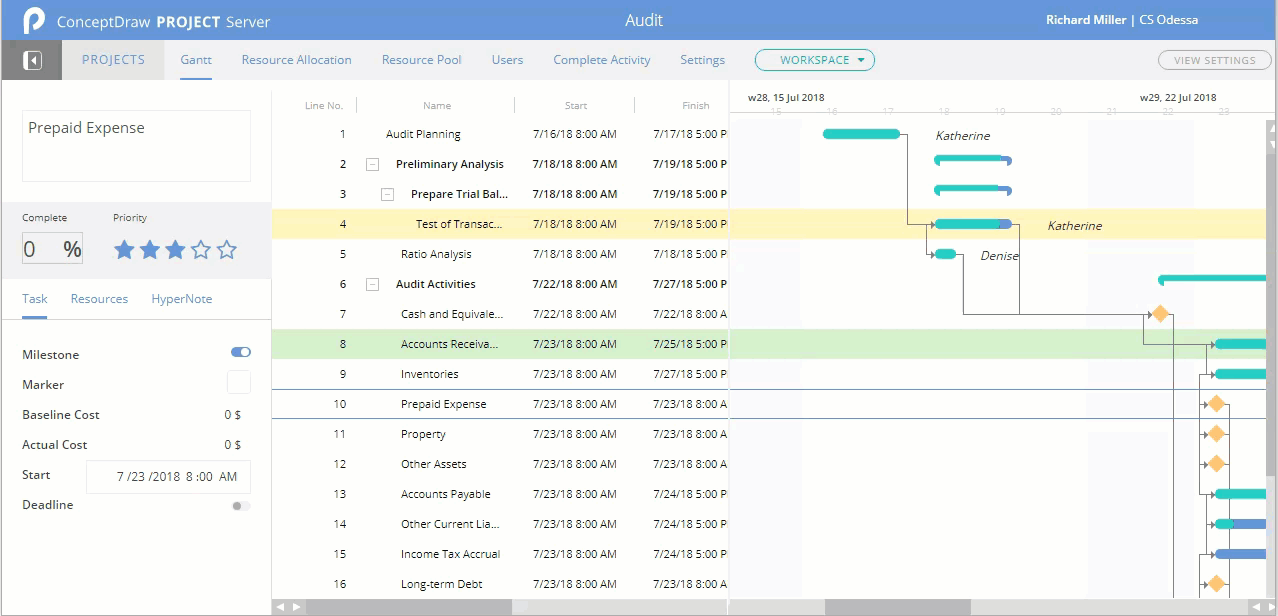
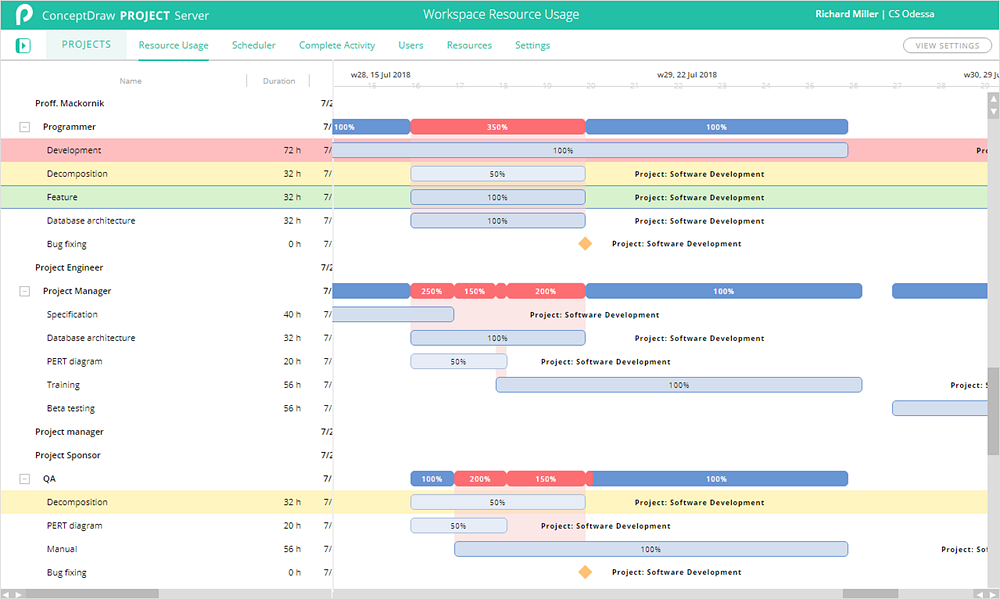
Project — Working With Costs

Remote Projects in Corporate Strategy

HelpDesk
How to Change the Timescale in a Gantt Chart View
HelpDesk
How to Add a Color Marker to Project Task on a Gantt Chart
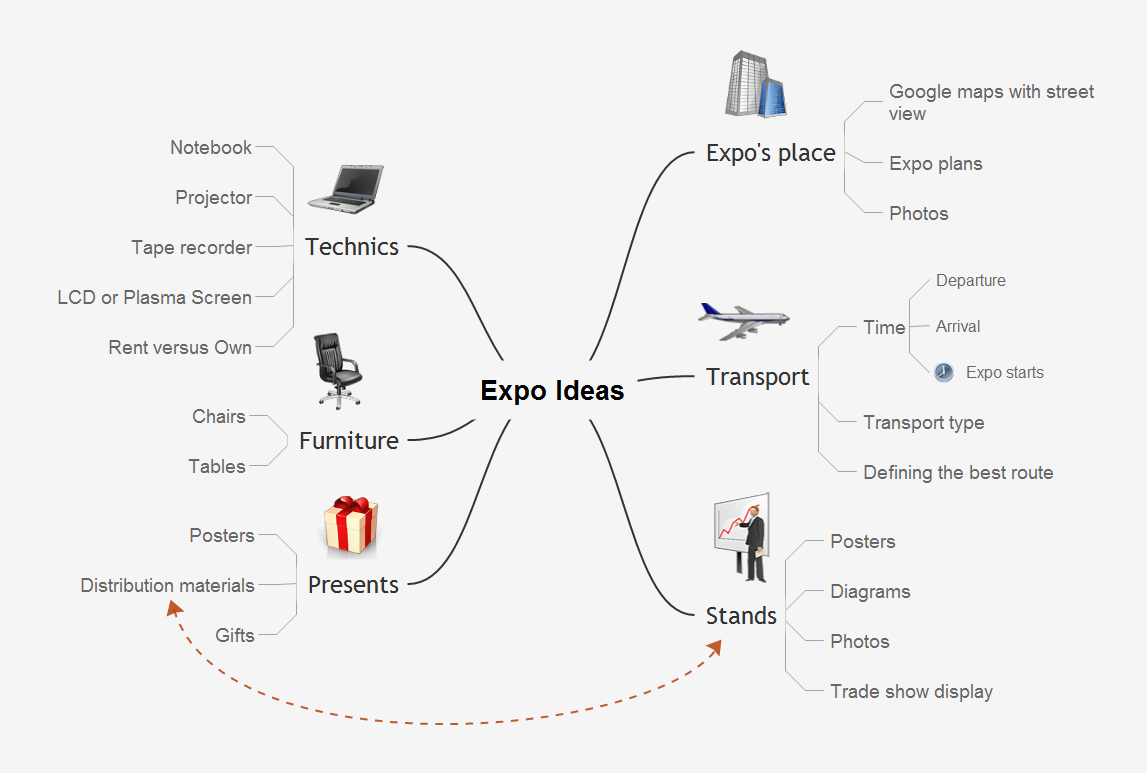
How to Create a Great Presentation
Gant Chart in Project Management


- Evernote Gantt Chart
- Launch Projects Exchanging Mind Maps with Evernote | Create a ...
- Successful Strategic Plan | What is Gantt Chart (historical reference ...
- Gantt Chart E
- Evernote Template
- How to Make a Project Tasks Mind Map from Brainstorm | How to ...
- Note Exchange | How to Send a Mind Map to Evernote | The Mind ...
- Product Overview | What can you create with ConceptDraw ...
- Project —Task Trees and Dependencies | | How To Plan and ...
- Successful Strategic Plan | Emergency Action Plan Template | Build ...
- ERD | Entity Relationship Diagrams, ERD Software for Mac and Win
- Flowchart | Basic Flowchart Symbols and Meaning
- Flowchart | Flowchart Design - Symbols, Shapes, Stencils and Icons
- Flowchart | Flow Chart Symbols
- Electrical | Electrical Drawing - Wiring and Circuits Schematics
- Flowchart | Common Flowchart Symbols
- Flowchart | Common Flowchart Symbols