PERT Chart Software

ConceptDraw DIAGRAM is a powerful diagramming and vector drawing software for designing professional looking PERT Charts quick and easy.
Program for Making Presentations
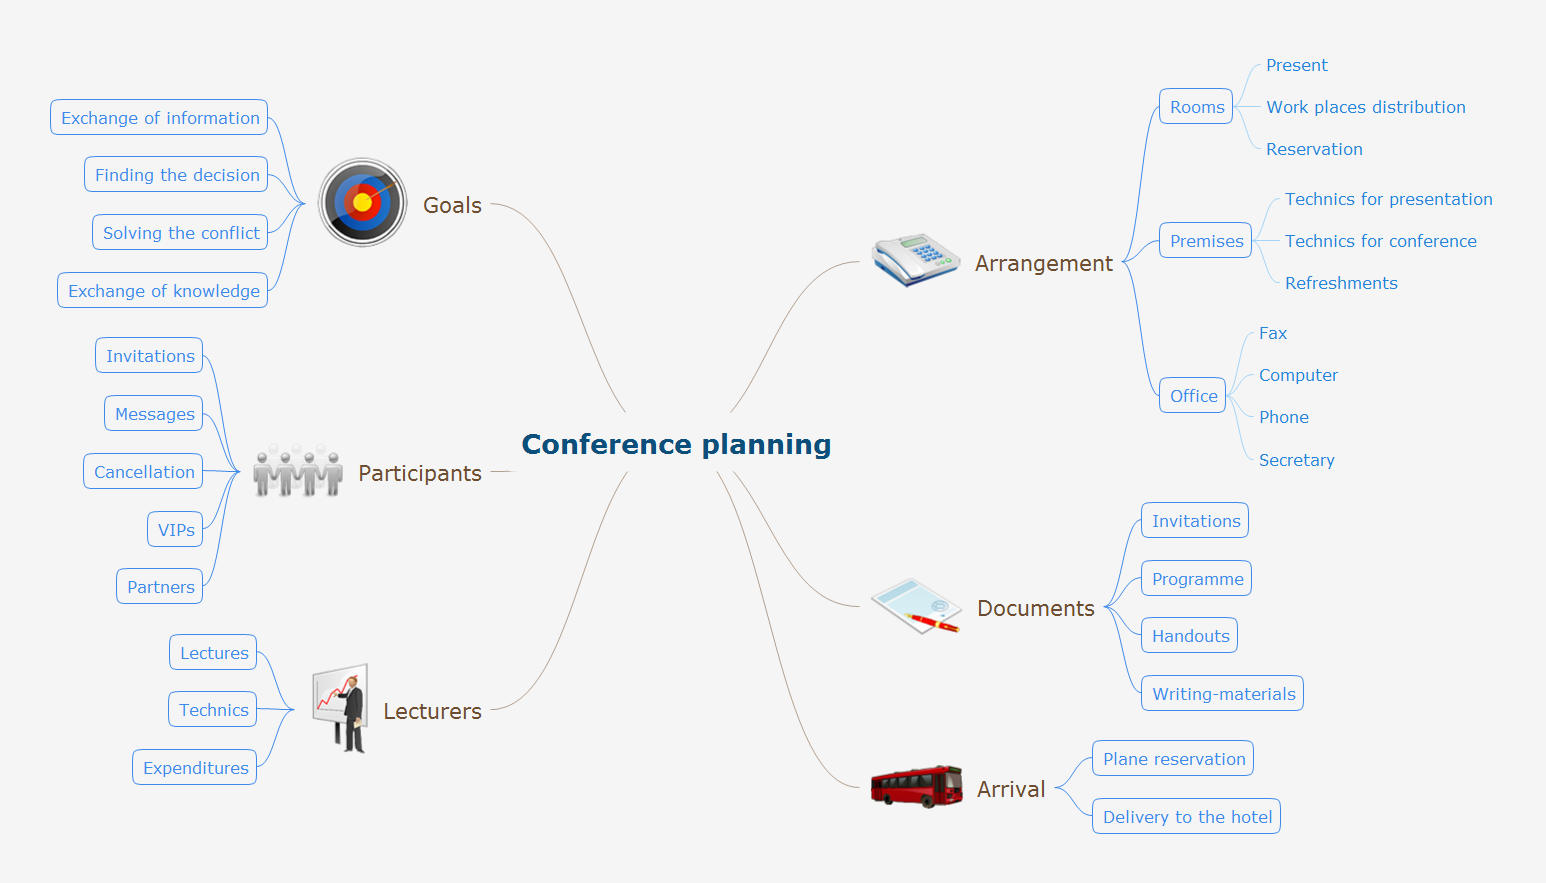
Program Evaluation and Review Technique (PERT) with ConceptDraw DIAGRAM

Business diagrams & Org Charts with ConceptDraw DIAGRAM


Basic Diagramming

Use Basic Diagramming solution to draw you own diagrams, charts and graphs for graphic communication, explanation of business and personal ideas and concepts, simple visual presentation of numerical data, complex structures, logical relations, step-by-step flows of actions or operations.

Activity on Node Network Diagramming Tool

This sample shows the Activity on node network diagramming method. It was created in ConceptDraw DIAGRAM diagramming and vector drawing software using the Seven Management and Planning Tools solution from the Management area of ConceptDraw Solution Park.
3 Circle Venn Diagram. Venn Diagram Example

Venn Diagrams visualize all possible logical intersections between several sets and are widely used in mathematics, logic, statistics, marketing, sociology, etc.
How To Create Onion Diagram

But how to create Onion Diagram? Now, it's very easy thanks to the ConceptDraw DIAGRAM diagramming and vector drawing software extended with Stakeholder Onion Diagrams Solution from the Management Area of ConceptDraw Solution Park.
 Seven Management and Planning Tools
Seven Management and Planning Tools solution extends ConceptDraw DIAGRAM and ConceptDraw MINDMAP with features, templates, samples and libraries of vector stencils for drawing management mind maps and diagrams.
Pyramid Diagram and Pyramid Chart

- Download Pert Chart Template For Powerpoint
- PERT chart - Template | Collaboration in a Project Team | Free ...
- How to Discover Critical Path on a Gantt Chart | IDEF0 Flowchart ...
- Onion Diagram Maker | Preventive Action | PERT Chart | Pert Chart ...
- How to Create a Timeline Diagram in ConceptDraw PRO | Business ...
- Business diagrams & Org Charts with ConceptDraw PRO ...
- Project Management Net Work Diagram Activity On Node
- Draw Network Diagram based on Templates and Examples | Using ...
- PERT chart - Template | Seven Management and Planning Tools ...
- Pdpc Ppt
- ERD | Entity Relationship Diagrams, ERD Software for Mac and Win
- Flowchart | Basic Flowchart Symbols and Meaning
- Flowchart | Flowchart Design - Symbols, Shapes, Stencils and Icons
- Flowchart | Flow Chart Symbols
- Electrical | Electrical Drawing - Wiring and Circuits Schematics
- Flowchart | Common Flowchart Symbols
- Flowchart | Common Flowchart Symbols