 Divided Bar Diagrams
The Divided Bar Diagrams Solution extends the capabilities of ConceptDraw PRO v10 with templates, samples, and a library of vector stencils for drawing high impact and professional Divided Bar Diagrams and Graphs, Bar Diagram Math, and Stacked Graph.
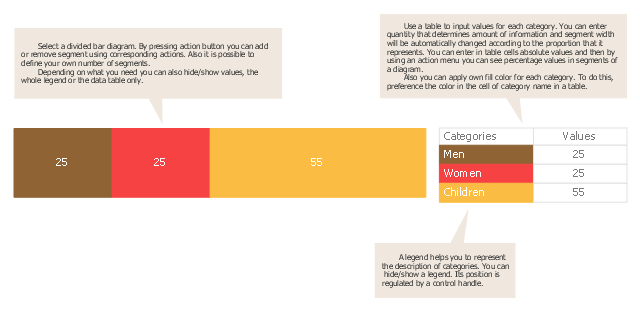
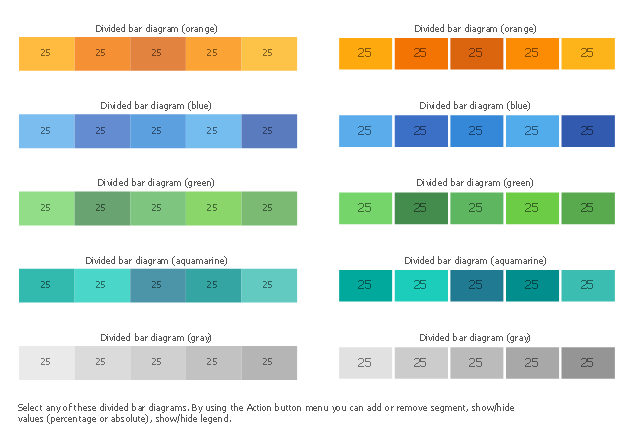
The vector stencils library "Divided bar diagrams" contains 12 templates of divided bar diagrams for visualizing percent composition of one total consists of few components.
Drag the template from the library to your document and enter your data.
Use these shapes to draw your divided bar diagrams in the ConceptDraw PRO diagramming and vector drawing software.
The vector stencils library "Divided bar diagrams" is included in the Divided Bar Diagrams solution from the Graphs and Charts area of ConceptDraw Solution Park.
Divided bar diagram (orange)
-divided-bar-diagrams---vector-stencils-library.png--diagram-flowchart-example.png)
Divided bar diagram (orange) 2
-2-divided-bar-diagrams---vector-stencils-library.png--diagram-flowchart-example.png)
Divided bar diagram (blue)
-divided-bar-diagrams---vector-stencils-library.png--diagram-flowchart-example.png)
Divided bar diagram (blue) 2
-2-divided-bar-diagrams---vector-stencils-library.png--diagram-flowchart-example.png)
Divided bar diagram (green)
-divided-bar-diagrams---vector-stencils-library.png--diagram-flowchart-example.png)
Divided bar diagram (green) 2
-2-divided-bar-diagrams---vector-stencils-library.png--diagram-flowchart-example.png)
Divided bar diagram (aquamarine)
-divided-bar-diagrams---vector-stencils-library.png--diagram-flowchart-example.png)
Divided bar diagram (aquamarine) 2
-2-divided-bar-diagrams---vector-stencils-library.png--diagram-flowchart-example.png)
Divided bar diagram (gray)
-divided-bar-diagrams---vector-stencils-library.png--diagram-flowchart-example.png)
Divided bar diagram (gray) 2
-2-divided-bar-diagrams---vector-stencils-library.png--diagram-flowchart-example.png)
Divided bar diagram (table)
-divided-bar-diagrams---vector-stencils-library.png--diagram-flowchart-example.png)
Divided bar diagram (table) 2
-2-divided-bar-diagrams---vector-stencils-library.png--diagram-flowchart-example.png)
HelpDesk
How to Draw a Divided Bar Chart in ConceptDraw PRO

 Basic Divided Bar Diagrams
This solution extends the capabilities of ConceptDraw PRO v10.3.0 (or later) with templates, samples and a library of vector stencils for drawing Divided Bar diagrams.
Use this chart template to design your divided bar diagrams.
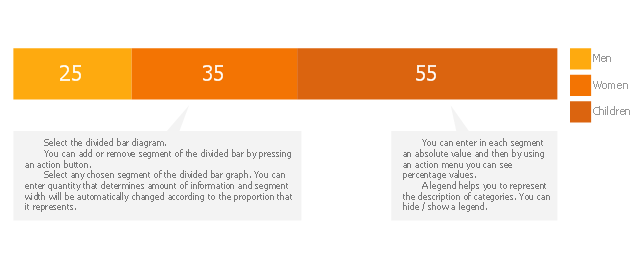
A divided bar chart is a rectangle divided into segments, illustrating numerical proportion. In a divided bar chart, the length of each segment (and consequently its area), is proportional to the quantity it represents.
This divided bar graph displays the number of people per day who visited swimming pool.
The template "Divided bar diagram" for the ConceptDraw PRO diagramming and vector drawing software is included in the Divided Bar Diagrams solution from the Graphs and Charts area of ConceptDraw Solution Park.
Template
The vector stencils library "Divided bar diagrams" contains 10 chart templates. Use it to draw your divided bar charts in the ConceptDraw PRO diagramming and vector drawing software.
A divided bar graph is a horizontal bar divided into segments to illustrate numerical proportion. Each segment length represents the percentage of the part in the 100% total amount.
The chart templates example "Design elements - Divided bar diagrams"
is included in the Basic Divided Bar Diagrams solution from the Graphs and Charts area of ConceptDraw Solution Park.
Chart templates
This divided bar graph displays the number of people per day who visited swimming pool. Use this template to design your divided bar charts.
The chart template "Divided bar diagram" for the ConceptDraw PRO diagramming and vector drawing software is included in the Basic Divided Bar Diagrams solution from the Graphs and Charts area of ConceptDraw Solution Park.
The chart template "Divided bar diagram" for the ConceptDraw PRO diagramming and vector drawing software is included in the Basic Divided Bar Diagrams solution from the Graphs and Charts area of ConceptDraw Solution Park.
Chart template
The vector stencils library "Composition indicators" contains 6 dashboard graphic indicators: 2 horizontal divided bars, 2 vertical divided bars, and 2 mini pie charts.
Composition Indicators are Live Objects which show the percentage of two parts of one total.
Composition Indicators useful for:
• comparison of one part with the total
• comparison of two parts of one total.
Use this library for drawing visual dashboards in the ConceptDraw PRO diagramming and vector drawing software extended with the Composition Dashboard solution from the area "What is a Dashboard" of ConceptDraw Solution Park.
www.conceptdraw.com/ solution-park/ composition-dashboard
Horizontal Divided Bar Indicator 1

Mini Pie Chart Indicator 1

Vertical Divided Bar Indicator 1

Horizontal Divided Bar Indicator 2

Vertical Divided Bar Indicator 2

Mini Pie Chart Indicator 2

Bar Diagram Math

Rainfall Bar Chart

This sample was created in ConceptDraw PRO diagramming and vector drawing software using the Bar Graphs Solution from the Graphs and Charts area of ConceptDraw Solution Park.
Bar Graph

This divided bar chart sample shows the petroleum products yielded from 1 barrel of crude oil in California in 2004. It was drawn using data from the chart on the California Energy Almanac website. [energyalmanac.ca.gov/ gasoline/ whats_ in_ barrel_ oil.html]
"Petroleum products are useful materials derived from crude oil (petroleum) as it is processed in oil refineries. Unlike petrochemicals, which are a collection of well-defined usually pure chemical compounds, petroleum products are complex mixtures. The majority of petroleum is converted to petroleum products, which includes several classes of fuels.
According to the composition of the crude oil and depending on the demands of the market, refineries can produce different shares of petroleum products. The largest share of oil products is used as "energy carriers", i.e. various grades of fuel oil and gasoline. These fuels include or can be blended to give gasoline, jet fuel, diesel fuel, heating oil, and heavier fuel oils. Heavier (less volatile) fractions can also be used to produce asphalt, tar, paraffin wax, lubricating and other heavy oils. Refineries also produce other chemicals, some of which are used in chemical processes to produce plastics and other useful materials. Since petroleum often contains a few percent sulfur-containing molecules, elemental sulfur is also often produced as a petroleum product. Carbon, in the form of petroleum coke, and hydrogen may also be produced as petroleum products. The hydrogen produced is often used as an intermediate product for other oil refinery processes such as hydrocracking and hydrodesulfurization." [Petroleum product. Wikipedia]
The chart example "Petroleum products yielded from one barrel of crude oil" was created using the ConceptDraw PRO diagramming and vector drawing software extended with the Divided Bar Diagrams solution from the Graphs and Charts area of ConceptDraw Solution Park.
Divided bar chart

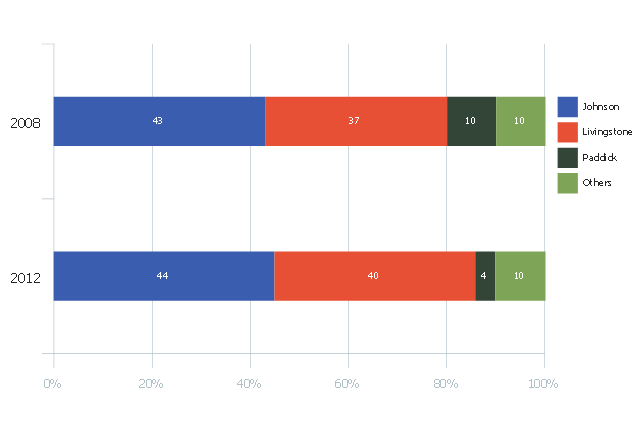
This divided bar diagram sample shows London election results in 2008 and 2012. It was drawn using data from the infographics "London Elections Results by Numbers" on the london.gov.uk website.
[data.london.gov.uk/ datastore/ package/ london-elections-results-2012-wards-boroughs-constituency]
"There are six types of elections in the United Kingdom: United Kingdom general elections, elections to devolved parliaments and assemblies, elections to the European Parliament, local elections, mayoral elections and Police and Crime Commissioner elections. Elections are held on Election Day, which is conventionally a Thursday. General elections do not have fixed dates, but must be called within five years of the opening of parliament following the last election. Other elections are held on fixed dates, though in the case of the devolved assemblies and parliaments early elections can occur in certain situations. Currently, six electoral systems are used: the single member plurality system (First Past the Post), the multi member plurality system, party list PR, the single transferable vote, the Additional Member System and the Supplementary Vote.
Elections are administered locally: in each lower-tier local authority, the actual polling procedure is run by the Returning Officer and the compiling and maintenance of the electoral roll by the Electoral Registration Officer (except in Northern Ireland, where the Electoral Office for Northern Ireland assumes both responsibilities). The Electoral Commission only sets standards for and issues guidelines to Returning Officers and Electoral Registration Officers, but is responsible for nationwide electoral administration (such as the registration of political parties and directing the administration of national referendums)." [Elections in the United Kingdom. Wikipedia]
The chart example "London election results" was created using the ConceptDraw PRO diagramming and vector drawing software extended with the Divided Bar Diagrams solution from the Graphs and Charts area of ConceptDraw Solution Park.
Divided bar chart
The Best Drawing Program for Mac

Bar Diagrams for Problem Solving. Create economics and financial bar charts with Bar Graphs Solution

- How to Draw a Divided Bar Chart in ConceptDraw PRO | Divided ...
- Diagramatic Of Divided Bar Graph
- Divided Bar Diagrams | How to Draw a Divided Bar Chart in ...
- Diagram Illustrating Divided Bar Chart
- Divided Bar Diagrams | Bar Diagrams for Problem Solving. Create ...
- Divided Bar Diagrams | Bar Diagram Math | Rainfall Bar Chart ...
- Divided Bar Diagrams | Bar Graphs | Bar Chart Template for Word ...
- Divided bar diagrams - Vector stencils library
- How to Draw a Divided Bar Chart in ConceptDraw PRO | Basic ...
- How to Draw a Divided Bar Chart in ConceptDraw PRO | Bar Chart ...
- Divided bar diagrams - Vector stencils library | Bar Diagram Math ...
- Bar Diagram Math | Divided bar diagram - Template | London ...
- Bar Diagram Math | Divided Bar Diagrams | Bar Graphs | 3 Bar ...
- Divided Bar Diagrams
- Bar Graphs | Divided Bar Diagrams | How to Draw a Divided Bar ...
- Divided Bar Diagrams | How To Create Restaurant Floor Plan in ...
- Bar Chart Examples | How to Draw a Divided Bar Chart in ...
- Bar Graph | Double bar graph - Template | Divided Bar Diagrams ...
- Bar Diagram Math | Divided Bar Diagrams | Double bar graph ...
- Divided Bar Diagrams | Basic Diagramming | Bar Chart Software ...
- ERD | Entity Relationship Diagrams, ERD Software for Mac and Win
- Flowchart | Basic Flowchart Symbols and Meaning
- Flowchart | Flowchart Design - Symbols, Shapes, Stencils and Icons
- Flowchart | Flow Chart Symbols
- Electrical | Electrical Drawing - Wiring and Circuits Schematics
- Flowchart | Common Flowchart Symbols
- Flowchart | Common Flowchart Symbols