Bar Chart Template for Word
All these bar chart templates are included in the Bar Graphs solution.You can quickly rework these bar graph templates into your own charts by simply changing displayed data, title and legend texts.
Feature Comparison Chart Software
An example of marketing analysis diagram, can be used to analyse product market and define marketing strategy.This sample shows the Feature Comparison Chart of the digital scouting cameras. It can be useful for digital cameras production field, marketing, sales, etc.
Basic Diagramming Flowchart Software
ConceptDraw PRO is a powerful intelligent vector graphics tool for drawing flowcharts.Process Flowchart
ConceptDraw is Professional business process mapping software for making process flow diagram, workflow diagram, general flowcharts and technical illustrations for business documents. It is includes rich examples, templates, process flowchart symbols. ConceptDraw flowchart maker allows you to easier create a process flowchart. Use a variety of drawing tools, smart connectors, flowchart symbols and shape libraries to create flowcharts of complex processes, process flow diagrams, procedures and information exchange.
Business diagrams & Org Charts with ConceptDraw PRO
Business flowcharting tool helps you create a flowchart with minimal effort. With ConceptDraw you can make a flowchart, draw data flow diagrams, orgchart professional, process flow diagrams etc - without any prior knowledge or training.
 Bar Graphs
The Bar Graphs solution enhances ConceptDraw PRO v10 functionality with templates, numerous professional-looking samples, and a library of vector stencils for drawing different types of Bar Graphs, such as Simple Bar Graph, Double Bar Graph, Divided Bar Graph, Horizontal Bar Graph, Vertical Bar Graph, and Column Bar Chart.
How To Create Restaurant Floor Plan in Minutes
Restaurant Floor Plans solution for ConceptDraw PRO has 49 extensive restaurant symbol libraries that contains 1495 objects of building plan elements; many examples and templates for drawing floor plans and restaurant layouts.It helps make a layout for a restaurant — restaurant floor plans, cafe floor plans, bar area, floor plan of a fast food restaurant, restaurant furniture layout, etc.
ConceptDraw PRO — great restaurant floor planner. You do not need to be an artist to create great-looking restaurant floor plans in minutes.

 ConceptDraw Solution Park
ConceptDraw Solution Park collects graphic extensions, examples and learning materials
Bar Diagrams for Problem Solving. Create manufacturing and economics bar charts with Bar Graphs Solution
Create bar charts for visualizing problem solving in manufacturing and economics using the ConceptDraw PRO diagramming and vector drawing software extended with the Bar Graphs Solution from the Graphs and Charts area of ConceptDraw Solition Park.Interactive Venn Diagram
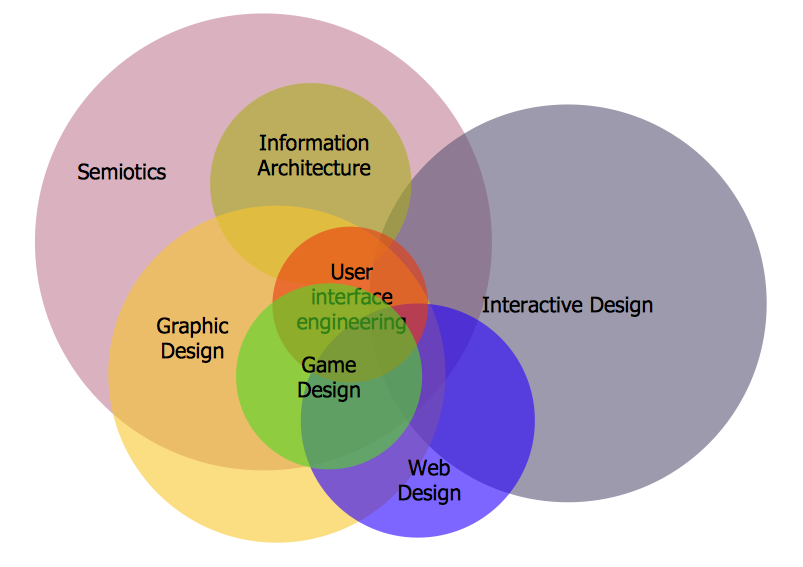
Venn Diagrams Solution offers you the Venn Diagrams library of ready-to-use vector objects and large collection of templates and samples allowing you create your own Interactive Venn Diagram in minutes.Venn Diagrams designed in ConceptDraw PRO are visual, bright, colorful, so they can be successfully used in different reports, appearances on the conferences, meetings.
ConceptDraw PRO - Organizational chart software
ConceptDraw - organizational chart software allows quickly create organizational charts, flow charts, time lines, and much more. Use it for drawing organizational chart for any size company and analyzing organizational structure.Spider Chart Template
This sample shows the Spider Chart that represents the budget and spending for one organization and allows to compare them. The multivariate data are represented on the Spider Chart as a two-dimensional chart with four or more variables displayed on the axes that start in one point. The Spider Charts are used in the management, business and sport.Business Structure
Each business is created, exists and develops according to its type of business structure. Creating new business or developing existing, you may need a powerful software for representing its business structure. In this case ConceptDraw PRO diagramming and vector drawing software extended with 25 Typical Orgcharts solution from the Management area is exactly what you need.Radar Chart
This sample shows the Radar Chart that compares the internet dimensions in the four countries. The Radar Chart represents the multivariate data as a two-dimensional chart with three or more variables displayed on the axes that start in one point. The Radar Charts are used in the quality management, business, analytics and sport.- Pie Chart Examples and Templates | Bar Chart Examples ...
- Dashboard Website Template
- Bar Chart Examples | Bar Chart Template | Column Chart Software ...
- Line Chart Template for Word | Flowchart Software | Process ...
- Line Chart Template for Word
- Sales Growth. Bar Graphs Example | Bar Chart Examples | Bar ...
- Line Graph Charting Software | Line Chart Template for Word | Pie ...
- Flowchart Components | Column Chart Template | Flowchart ...
- Product Comparison Dashboard Template Website
- Pie Chart Examples and Templates | Bar Chart Examples | Business ...
- Feature Comparison Chart Software | Marketing | Bar Chart ...
- Feature Comparison Chart Software | Bar Chart Template for Word ...
- How to Draw a Divided Bar Chart in ConceptDraw PRO | Divided ...
- Manufacturing in America | Picture graph - Template | Manufacturing ...
- Double bar graph - Template
- Spider Chart Template | Percentage Spider Chart | Chart Maker for ...
- Graph Websites
- Basic Diagramming | Create Graphs and Charts | Bar Graphs ...
- Website metrics - Visual dashboard | Website traffic dashboard ...
- Process Flowchart | Basic Flowchart Symbols and Meaning | Bar ...
- ERD | Entity Relationship Diagrams, ERD Software for Mac and Win
- Flowchart | Basic Flowchart Symbols and Meaning
- Flowchart | Flowchart Design - Symbols, Shapes, Stencils and Icons
- Flowchart | Flow Chart Symbols
- Electrical | Electrical Drawing - Wiring and Circuits Schematics
- Flowchart | Common Flowchart Symbols
- Flowchart | Common Flowchart Symbols


