UML Deployment Diagram. Design Elements
UML Deployment Diagram is a type of Structure Diagrams that shows the physical deployment of information generated by the software programs.
The information generated by the software is called “artifact”. The hardware with installed software is called “node”. Thus, UML Deployment Diagram models the physical deployment of artifacts on nodes.
UML Deployment Diagram is intended for visualization of elements and components of the program that exist only on the stage of its runtime. The development of the Deployment Diagram is the last stage of the specification of the software system model.
UML Deployment Diagram represents the nodes as boxes, and the artifacts as rectangles within the boxes. The nodes can have subnodes that are represented as nested boxes. One node on the UML Deployment Diagram can conceptually describe more than one physical node.
There are two types of nodes: device nodes and execution environment nodes.
Device nodes are the computing resources with capability of processing memory and executing of software. An execution environment node (EEN) is a computer system that is located inside a device node.
The other shapes the most used in UML Deployment Diagrams are:
- Communication path - a line that connect two device nodes and represents communications between them.
- Package - a file shaped box that groups together all the device nodes.
- Data Store, Frames, Components UML, and others.
The Rapid UML Solution for ConceptDraw DIAGRAM contains 13 vector stencils libraries with 393 interactive shapes that you can use to design your UML diagrams.
To design a Deployment Diagram use the UML Deployment Diagram library.
UML Deployment Diagram library contains 31 shapes:
- Device node
- Artifact
- Component
- Component 2
- Deployment specification
- User
- Data store
- Package
- Dependency
- Communication path
- Communication line
- Request
- Association Many-to-Many
- Association One-to-Many
- Frame, fragment
- Note
- Aggregation
- Composition
- Constraint
- Generalization
- Realization
- Interface with connector
- Processor node
- Execution environment node
- Smart connector
- Line connector
- Interface
- Provided interface
- Provided interface (reverse)
- Required interface
- Required interface (reverse)
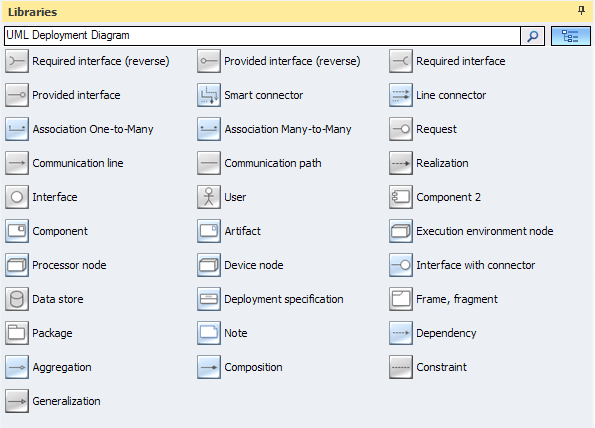
Pic.1. UML Deployment Diagram Library

Pic.2. UML Deployment Diagram Library Elements
ConceptDraw Rapid UML solution provides UML Deployment Diagram library of vector stencils for drawing the deployment diagrams using deployment blocks and assembly connectors.
Use design element from the UML Deployment Diagram library to draw your own UML deployment diagrams of complex systems and software applications.


This sample was created in ConceptDraw DIAGRAM diagramming and vector drawing software using the UML Deployment Diagram library of the Rapid UML Solution from the Software Development area of ConceptDraw Solution Park.

TEN RELATED HOW TO's:
How to describe the necessity of using network security devices and visually illustrate this information? Now, it's very easy thanks to the ConceptDraw DIAGRAM diagramming and vector drawing software extended with Network Security Diagrams Solution from the Computer and Networks Area of ConceptDraw Solution Park.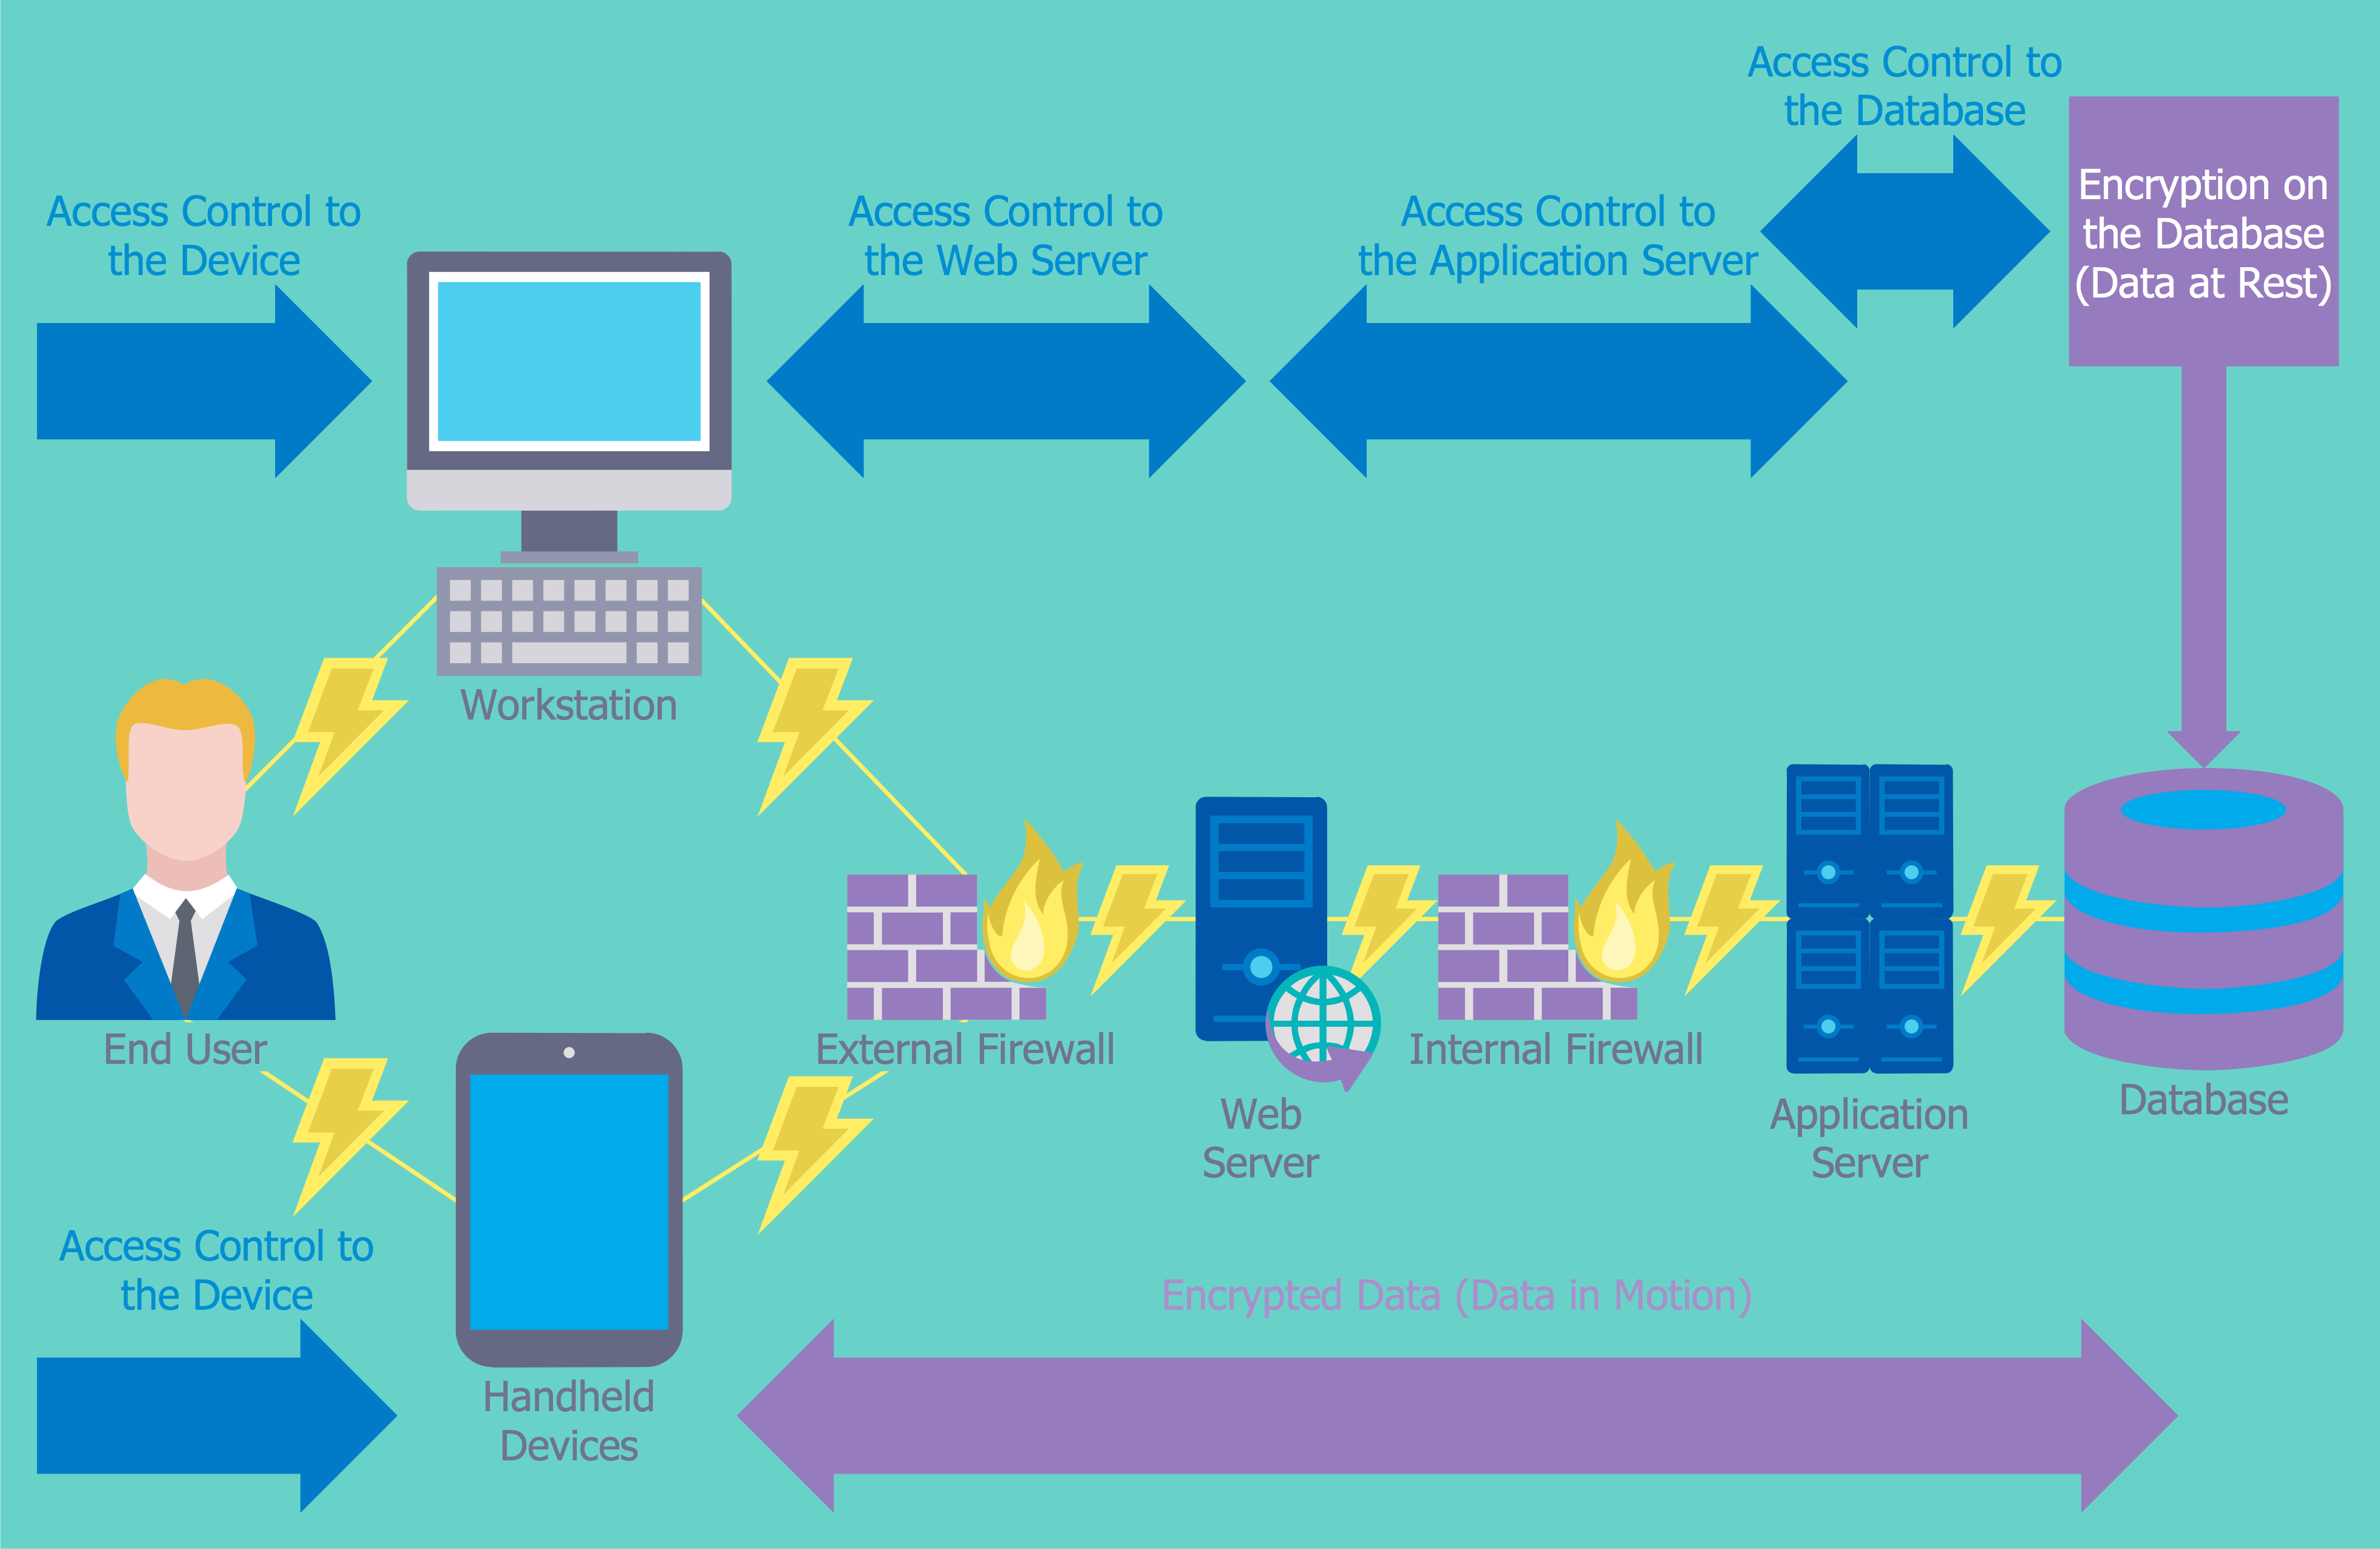
Picture: Network Security Devices
Related Solution:
ConceptDraw - Organigram software allows quickly create Organigrams and much more. ConceptDraw DIAGRAM is an ideal tool for Administrative staff to clearly demonstrate the company orgchart professional.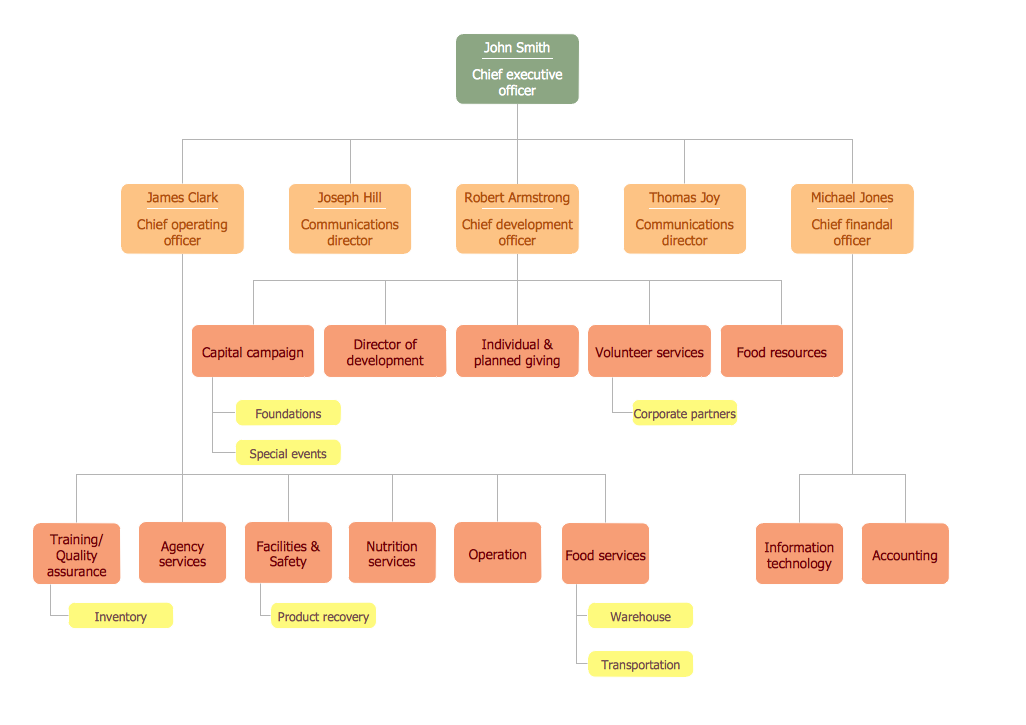
Picture: Organigrams with ConceptDraw DIAGRAM
Related Solution:
Electrical Engineering Solution used together with ConceptDraw DIAGRAM drawing facilities makes short a work of drawing various electrical and electronic circuit schemes. A library of vector objects composed from symbols of Analog and Digital Logic elements of electric circuit includes 40 symbolic images of logic gates, bistable switches of bi-stable electric current, circuit controllers, amplifiers, regulators, generators, etc. All of them can be applied in electronic circuit schemes for showing both analog and digital elements of the circuit.
Electrical Engineering Solution used together with ConceptDraw DIAGRAM drawing facilities makes short a work of drawing various electrical and electronic circuit schemes. A library of vector objects composed from symbols of Analog and Digital Logic elements of electric circuit includes 40 symbolic images of logic gates, bistable switches of bi-stable electric current, circuit controllers, amplifiers, regulators, generators, etc. All of them can be applied in electronic circuit schemes for showing both analog and digital elements of the circuit.
Picture:
Electrical Diagram Symbols F.A.Q.
How to Use Electrical ConceptDraw Diagram Software
Related Solution:
Multiprotocol Label Switching (MPLS) is a mechanism in high-performance telecommunication networks that implements the data transfer from one network node to another using the labels.
ConceptDraw DIAGRAM is a powerful network diagramming and vector drawing software that provides the Computer and Networks solution with wide set of ready-to-use predesigned vector stencils and examples to help you design the MPLS Networks quick and easy.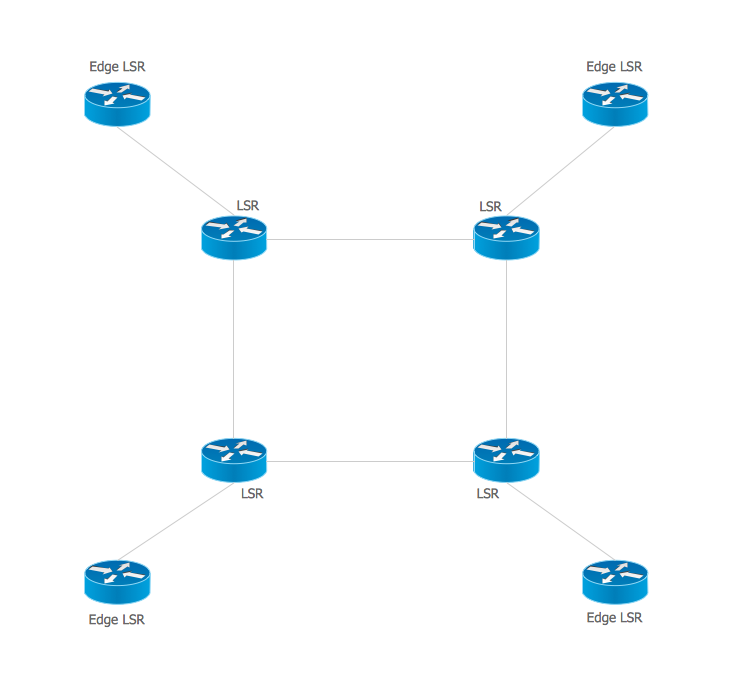
Picture: Multiprotocol Label Switching (MPLS). Computer and Network Examples
Related Solution:
A Venn diagram, sometimes referred to as a set diagram, is a diagramming style used to show all the possible logical relations between a finite amount of sets. Having ConceptDraw DIAGRAM software one allows anyone who cares for their drawings to look not only nice but also smart and professional.
Picture:
Venn Diagram Examples for Problem Solving
Computer Science. Chomsky Hierarchy
Related Solution:
It doesn’t matter what kind of business you have, a bar or a gym, there are common concepts for any of them. One of those concepts is accounting, and to facilitate the work with the figures, you can use accounting flowchart symbols and create a clear and representative scheme. You can create flowchart for auditing, tax accounting and even for planning your own budget.
A graphical tool for displaying successive processes is flowchart. This method is mostly suited to represent an accounting process. The sequence of steps in the accounting process usually consists of standard accounting procedures, that can be depicted by using a minimal number of symbols, applied for the basic flowcharting. The advanced opportunity to create professional Accounting Flow charts is provided by ConceptDraw Accounting Flowcharts solution. It includes contains a library of accounting flowchart symbols used when drawing the accounting process flow.
Picture: Accounting Flowchart Symbols
Related Solution:
But it never matters which hotel plan you want to illustrate in a way of a floor plan, you can always do it with ConceptDraw DIAGRAM especially it can be simple to do having the “Floor Plans” solution, which can be downloaded from the Building Plans area of ConceptDraw Solution Park.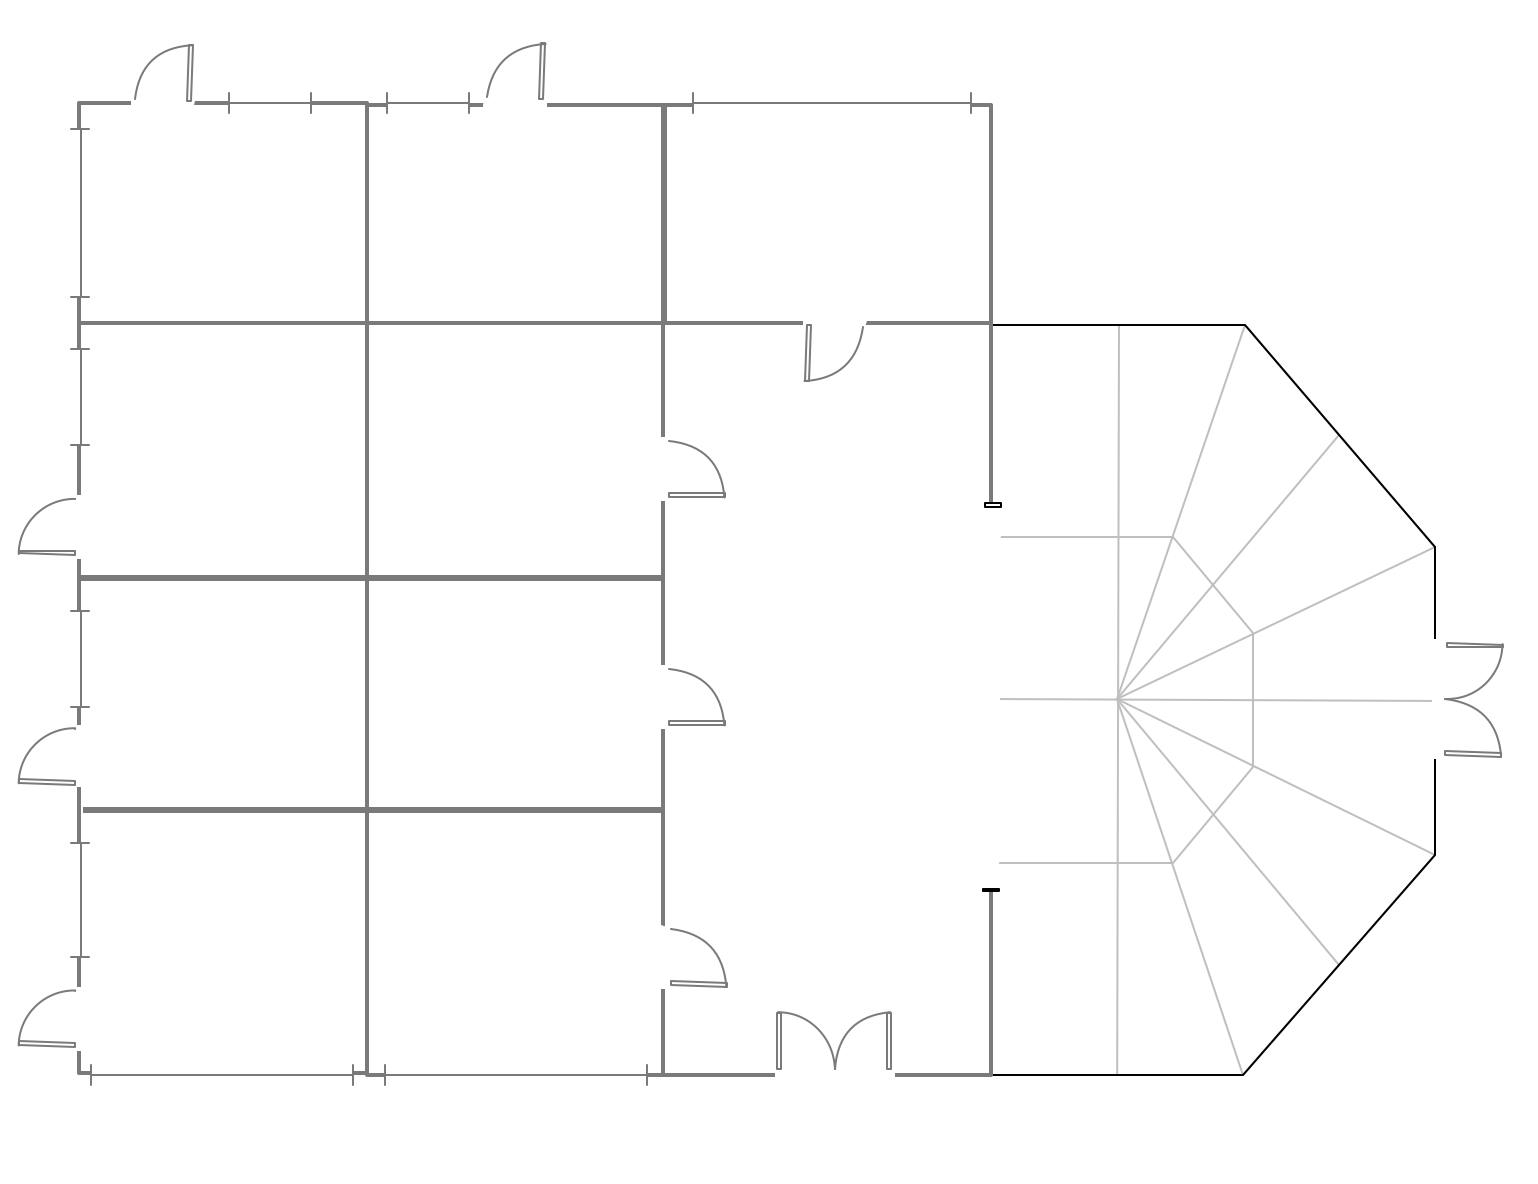
Picture: Mini Hotel Floor Plan. Floor Plan Examples
Related Solution:
A Home Area Networks (HAN) is a type of local area network that is used in an individual home. The home computers can be connected together by twisted pair or by a wireless network. HAN facilitates the communication and interoperability among digital devices at the home, allows to easier access to the entertainments and increase the productivity, organize the home security.
This example was created in ConceptDraw DIAGRAM using the Computer and Networks Area of ConceptDraw Solution Park and shows the home network diagram.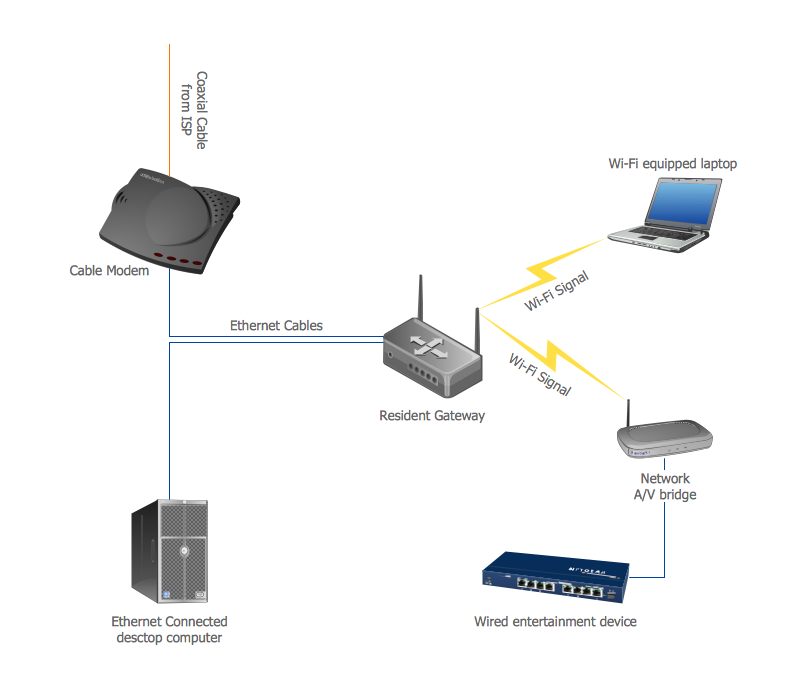
Picture: Home area networks (HAN). Computer and Network Examples
Related Solution:


