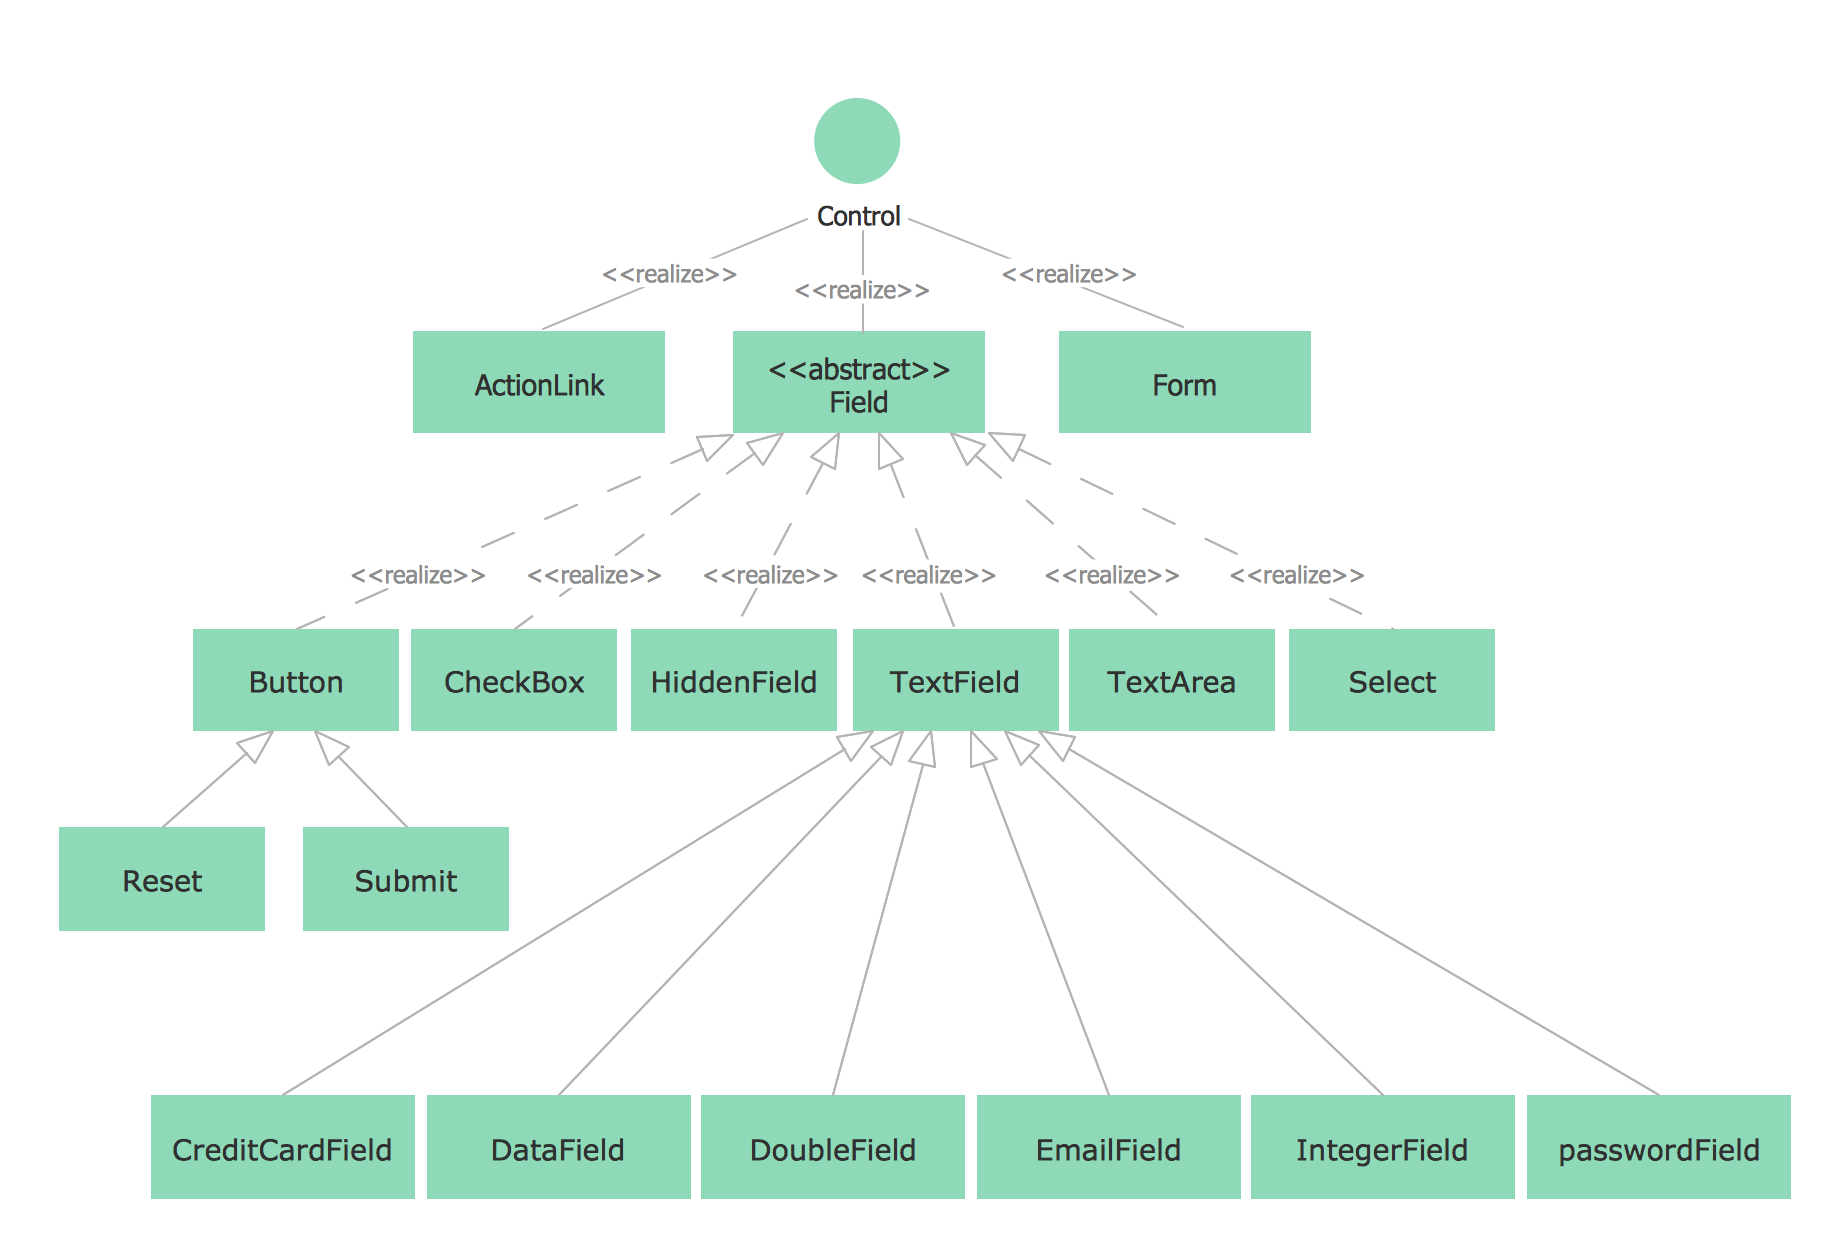
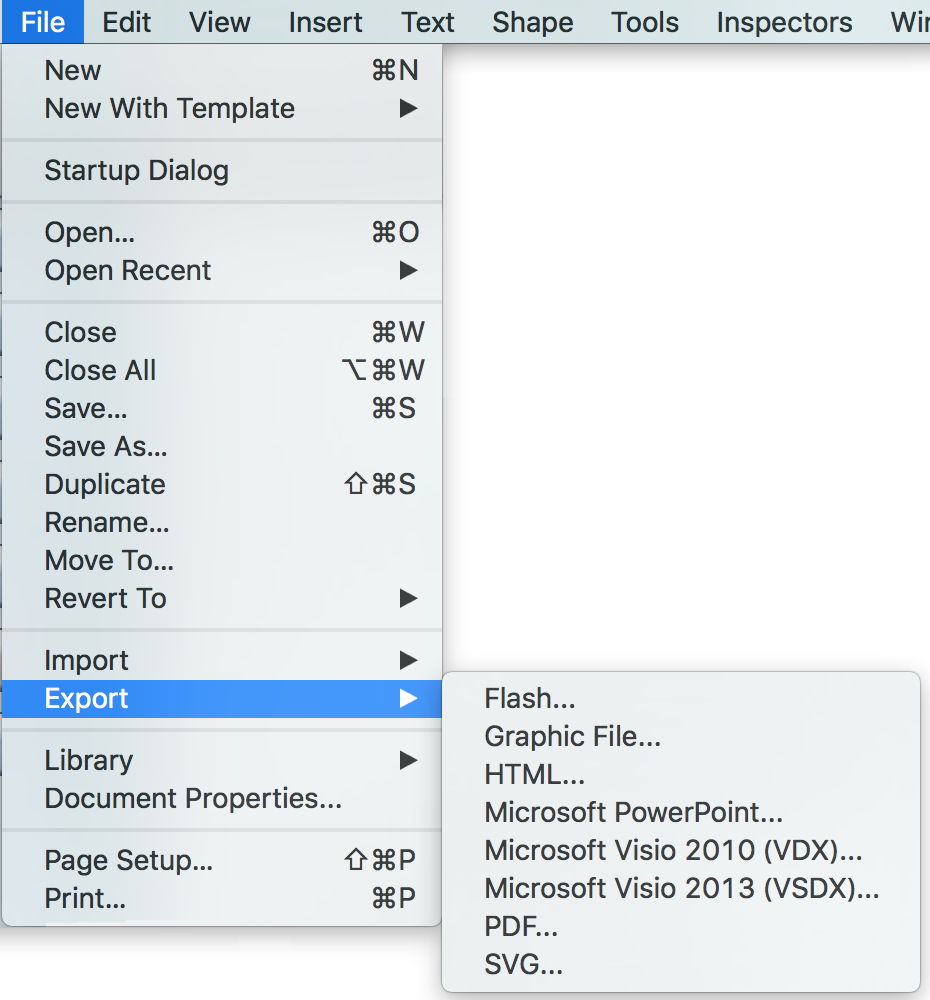
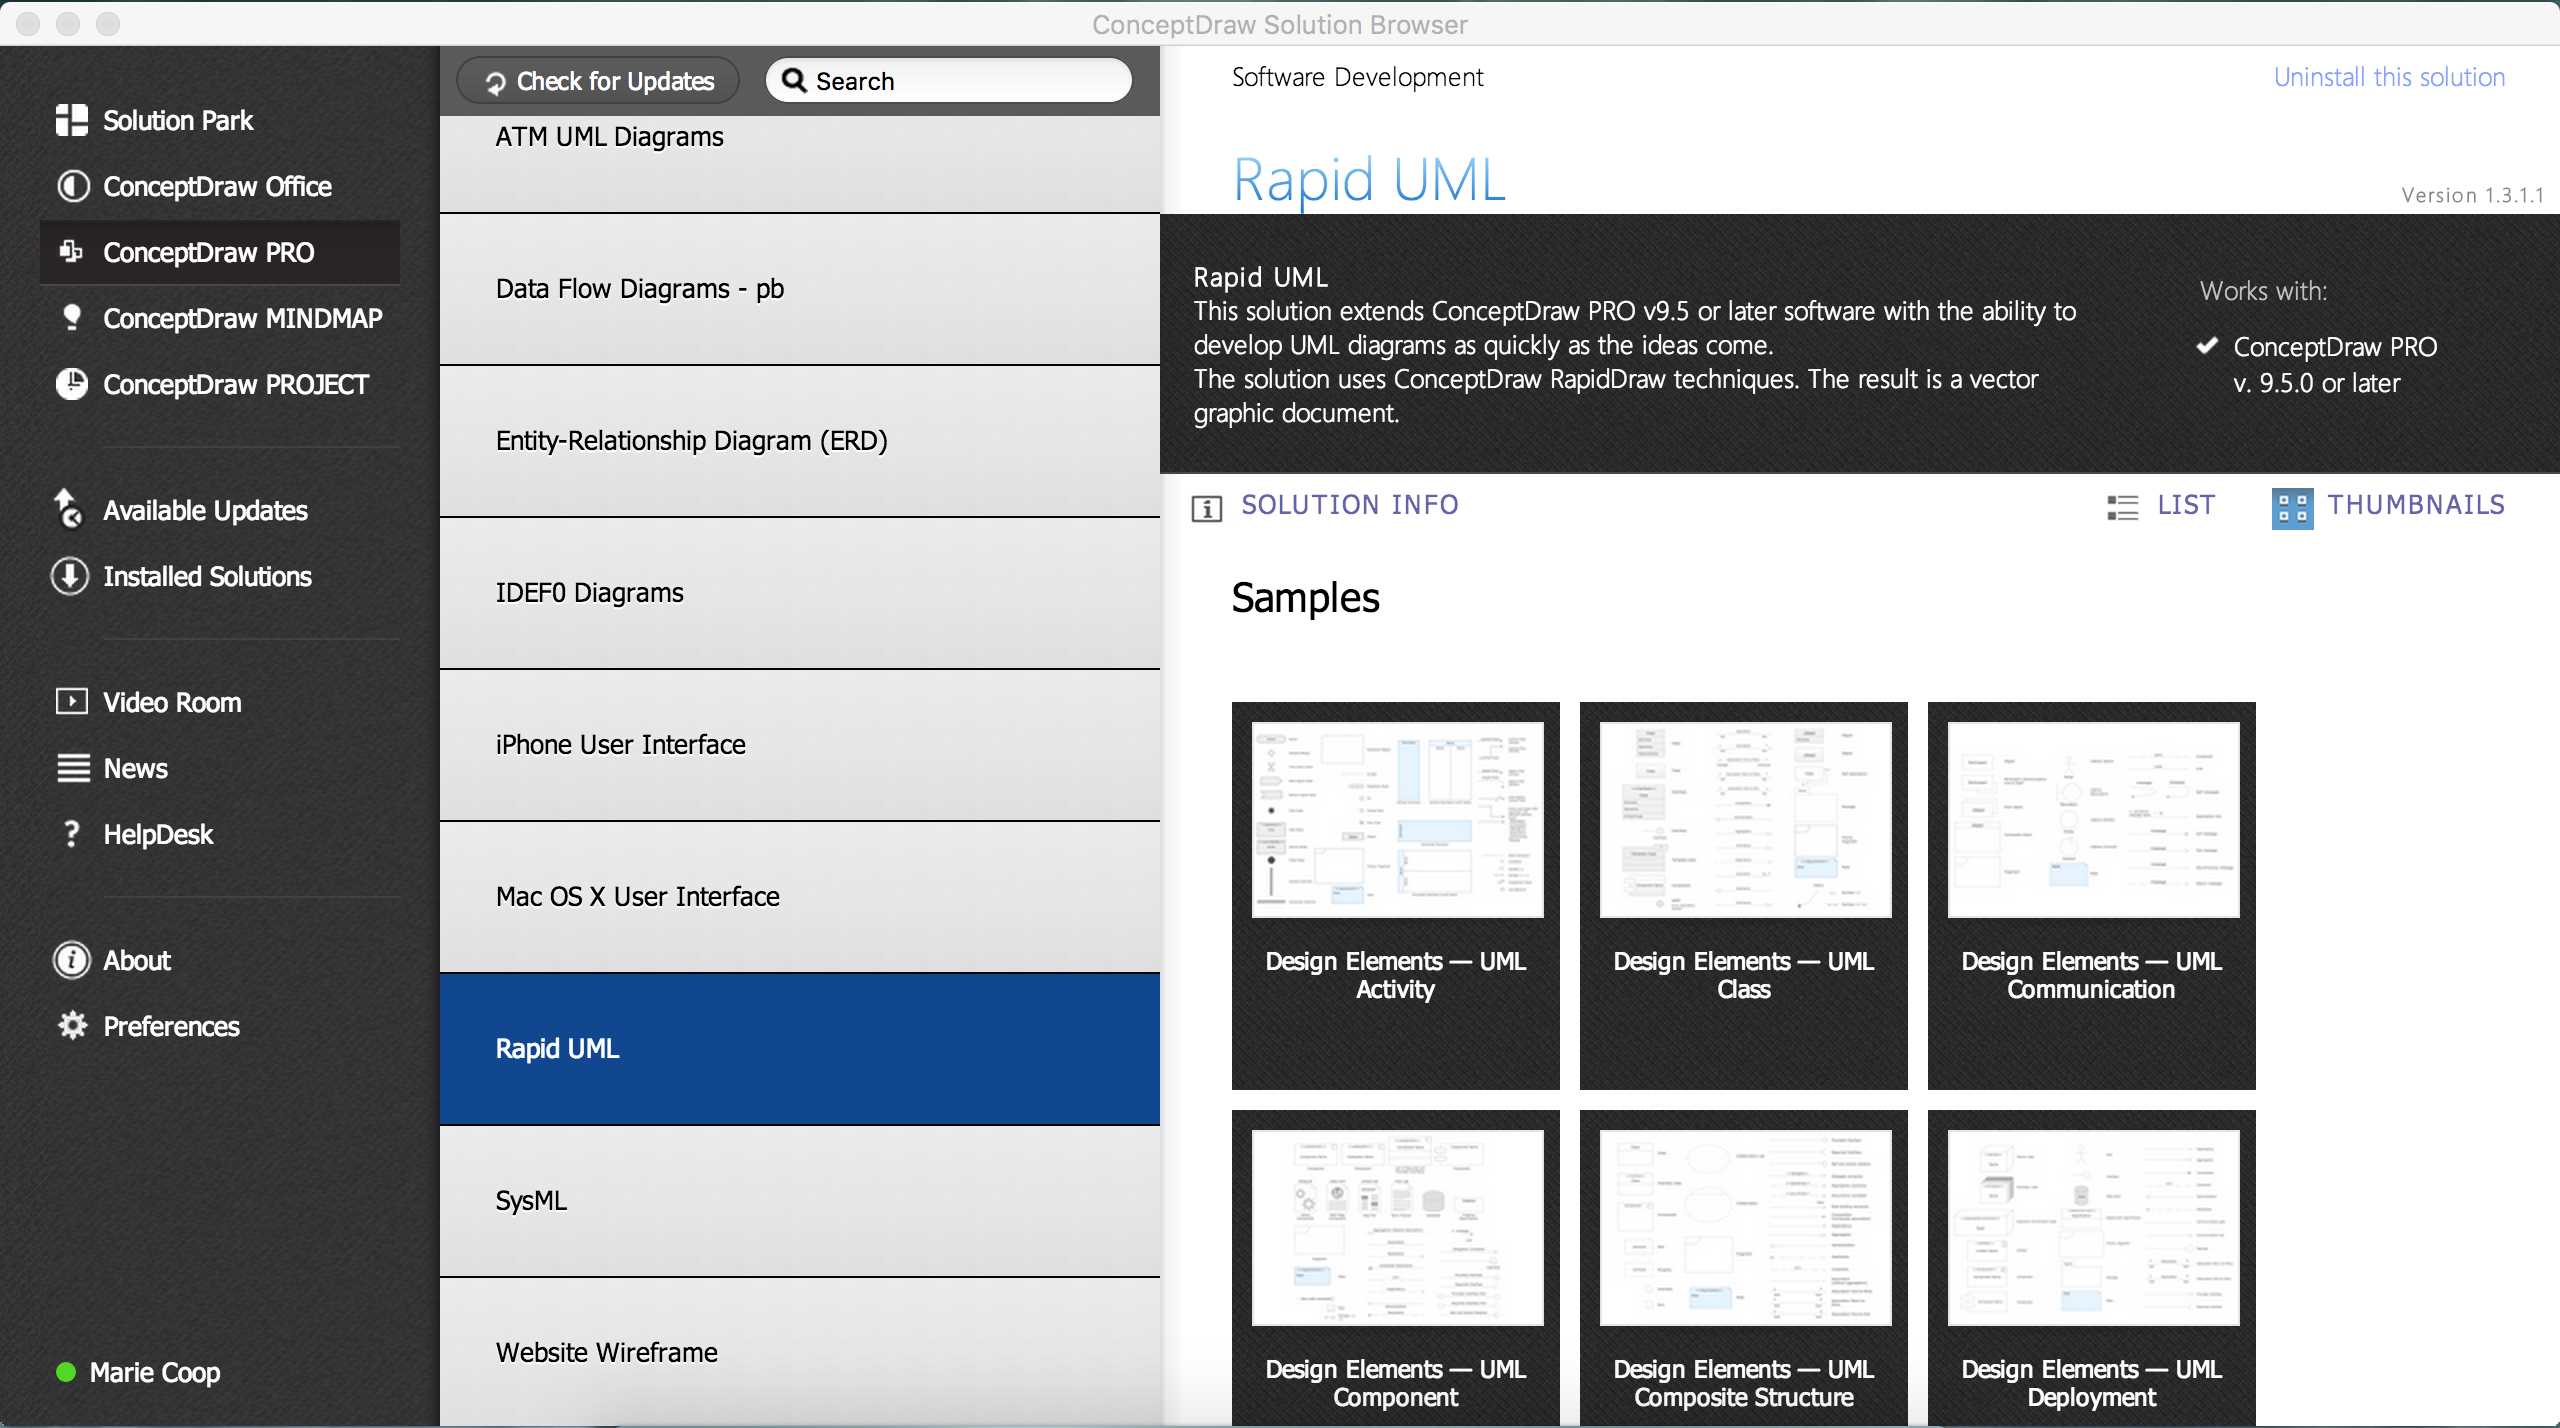
ConceptDraw DIAGRAM is designed to help you create UML diagrams quickly and easily. You'll get ready-made templates, examples and symbols as well as tools specifically designed to build the diagram you need.
The following table represents notations that are used on the UML Class Diagrams:
| Diagram element |
Graphical presentation |
Description |
| Class |
 |
Class represents a set of objects that have the same structure, behavior, and relationships with objects of other classes. |
| Attribute |
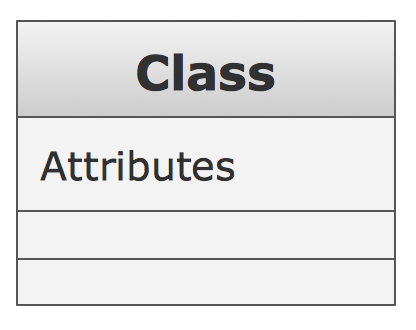 |
Attribute is a typed value that defines the properties and behavior of the object. |
| Operation |
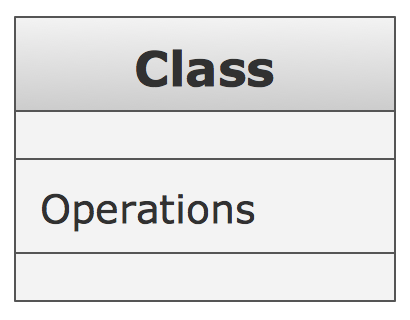
|
Operation is a function that can be applied to the objects of a given class. |
| Responsibility |
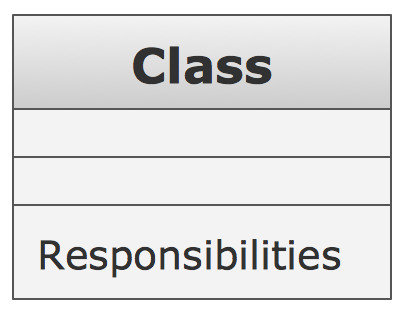
|
Responsibility is a contract which the class must conform. |
| Interface |
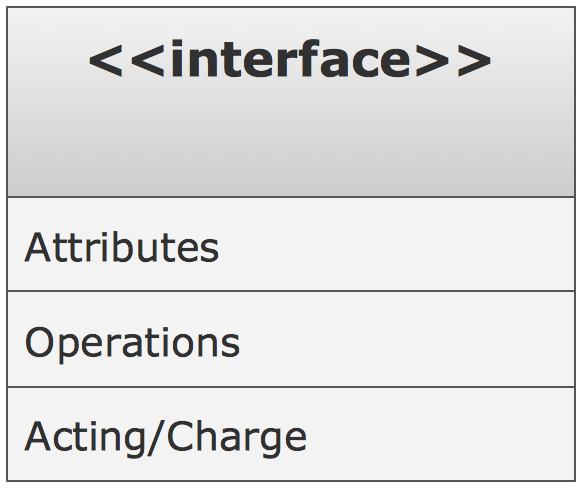
|
Interface is an abstract class that defines a set of operations that the object of the class associated with this interface provides to other objects.
|
| Association |
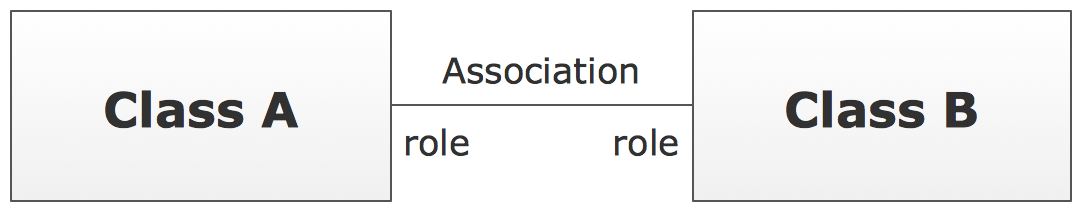
|
Association is a relationship that connect two classes. |
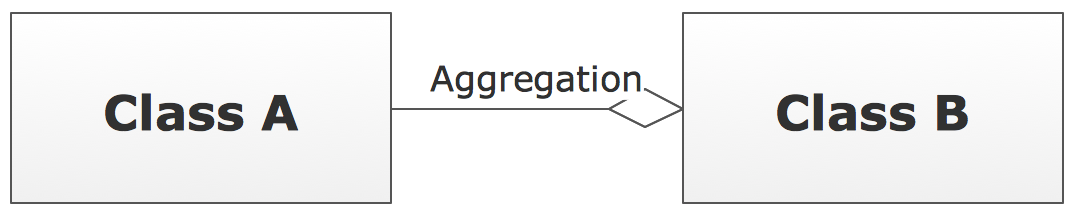
| Aggregation |
|
Aggregation is an association with the relation between the whole and its parts, the relation when one class is a certain entity that includes the other entities as components. |
| N-ary Association |

|
N-ary association represents two or more aggregations. |
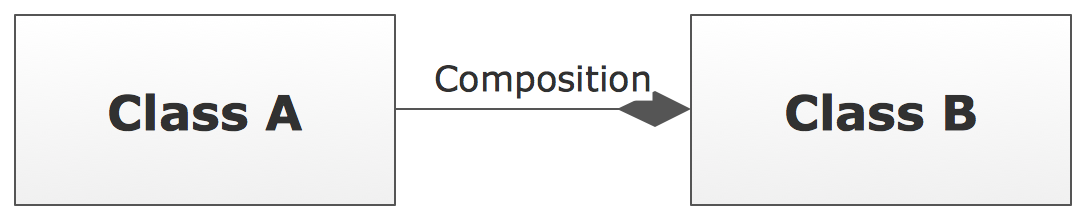
| Composition |
|
Composition is a strong variant of aggregation when parts cannot be separately of the whole. |
| Generalization |

|
Generalization ia an association between the more general classifier and the more special classifier. |
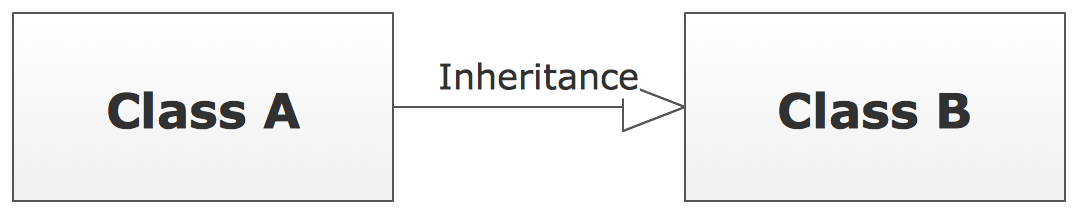
| Inheritance |
|
Inheritance is a relationship when a child object or class assumes all properties of his parent object or class. |
| Realization |

|
Realization is a relationship between interfaces and classes or components that realize them. |
| Dependency |

|
Dependency is a relationship when some changes of one element of the model can need the change of another dependent element. |
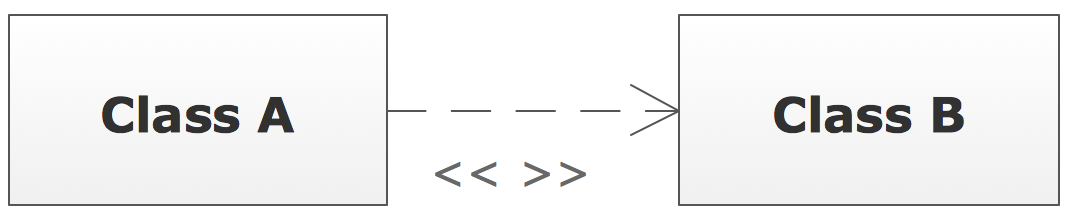
| << >> |
|
Allows to define the properties of the dependency relationship between classes or classes and packages. |
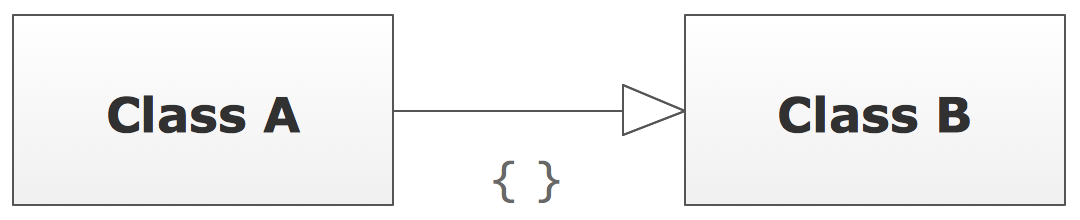
| { } |
|
Allows to indicate the additional properties of association. |
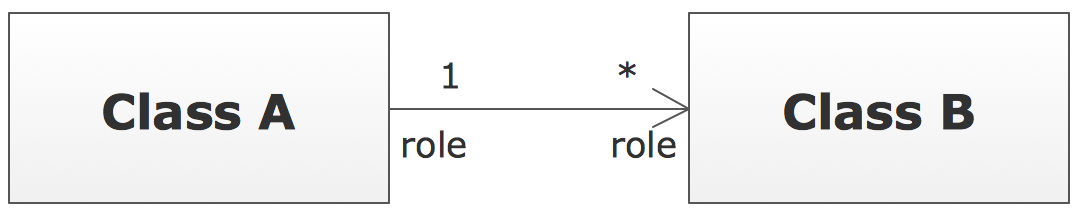
| Multiplicity |
|
Multiplicity shows the quantity of instances of one class that are linked to one instance of the other class. |
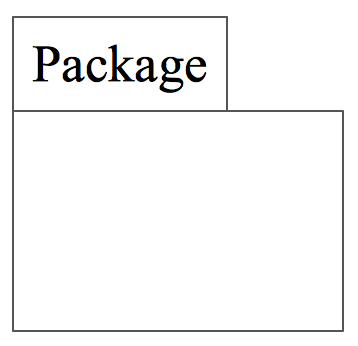
| Package |
|
Package groups the classes and other packages. |
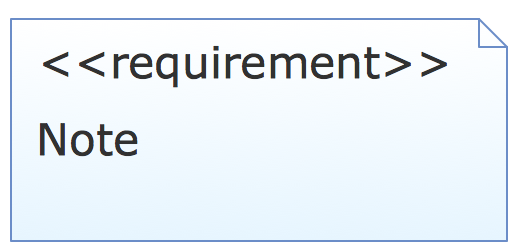
| Note |
|
Note is a textual explication. |
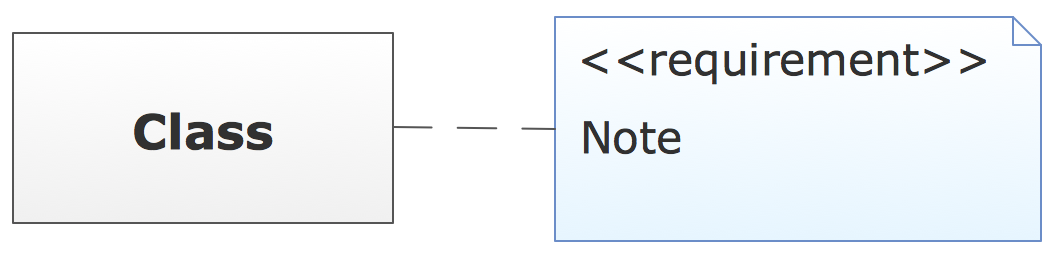
| Note connector |
|
Note connector is a connection between the note and elements. |
TEN RELATED HOW TO's:
Use the set of special professionally developed swim lane flowchart symbols - single, multiple, vertical and horizontal lanes from the Swimlanes and Swimlanes BPMN 1.2 libraries from the Business Process Diagram solution, the Swim Lanes library from the Business Process Mapping solution as the perfect basis for your Swim Lane Flowcharts of processes, algorithms and procedures.
Picture: Swim Lane Flowchart Symbols
Related Solution:
ConceptDraw DIAGRAM extended with Chemistry solution is effective for drawing various organic chemistry schemes, diagrams, illustrations thanks to the included collection of predesigned organic chemistry symbols
Picture: Organic Chemistry Symbols
Related Solution:
IT world is extremely rational and logical. So what can be more precise than Software Diagrams to rate the results of work? Visual statistics is the best way to understand the data.
This figure demonstrates the data flow diagram (DFD), which was created to describe the electronic system of custom purchase. This is the process of buying using electronic bar code scanning system. Such systems are used in large stores. The cashier scans the bar code, the system outputs the data on the price of the goods and carries out a purchase process. This DFD utilizes the Gane/Sarson notation. To create it The ConceptDraw DFD solution has been applied.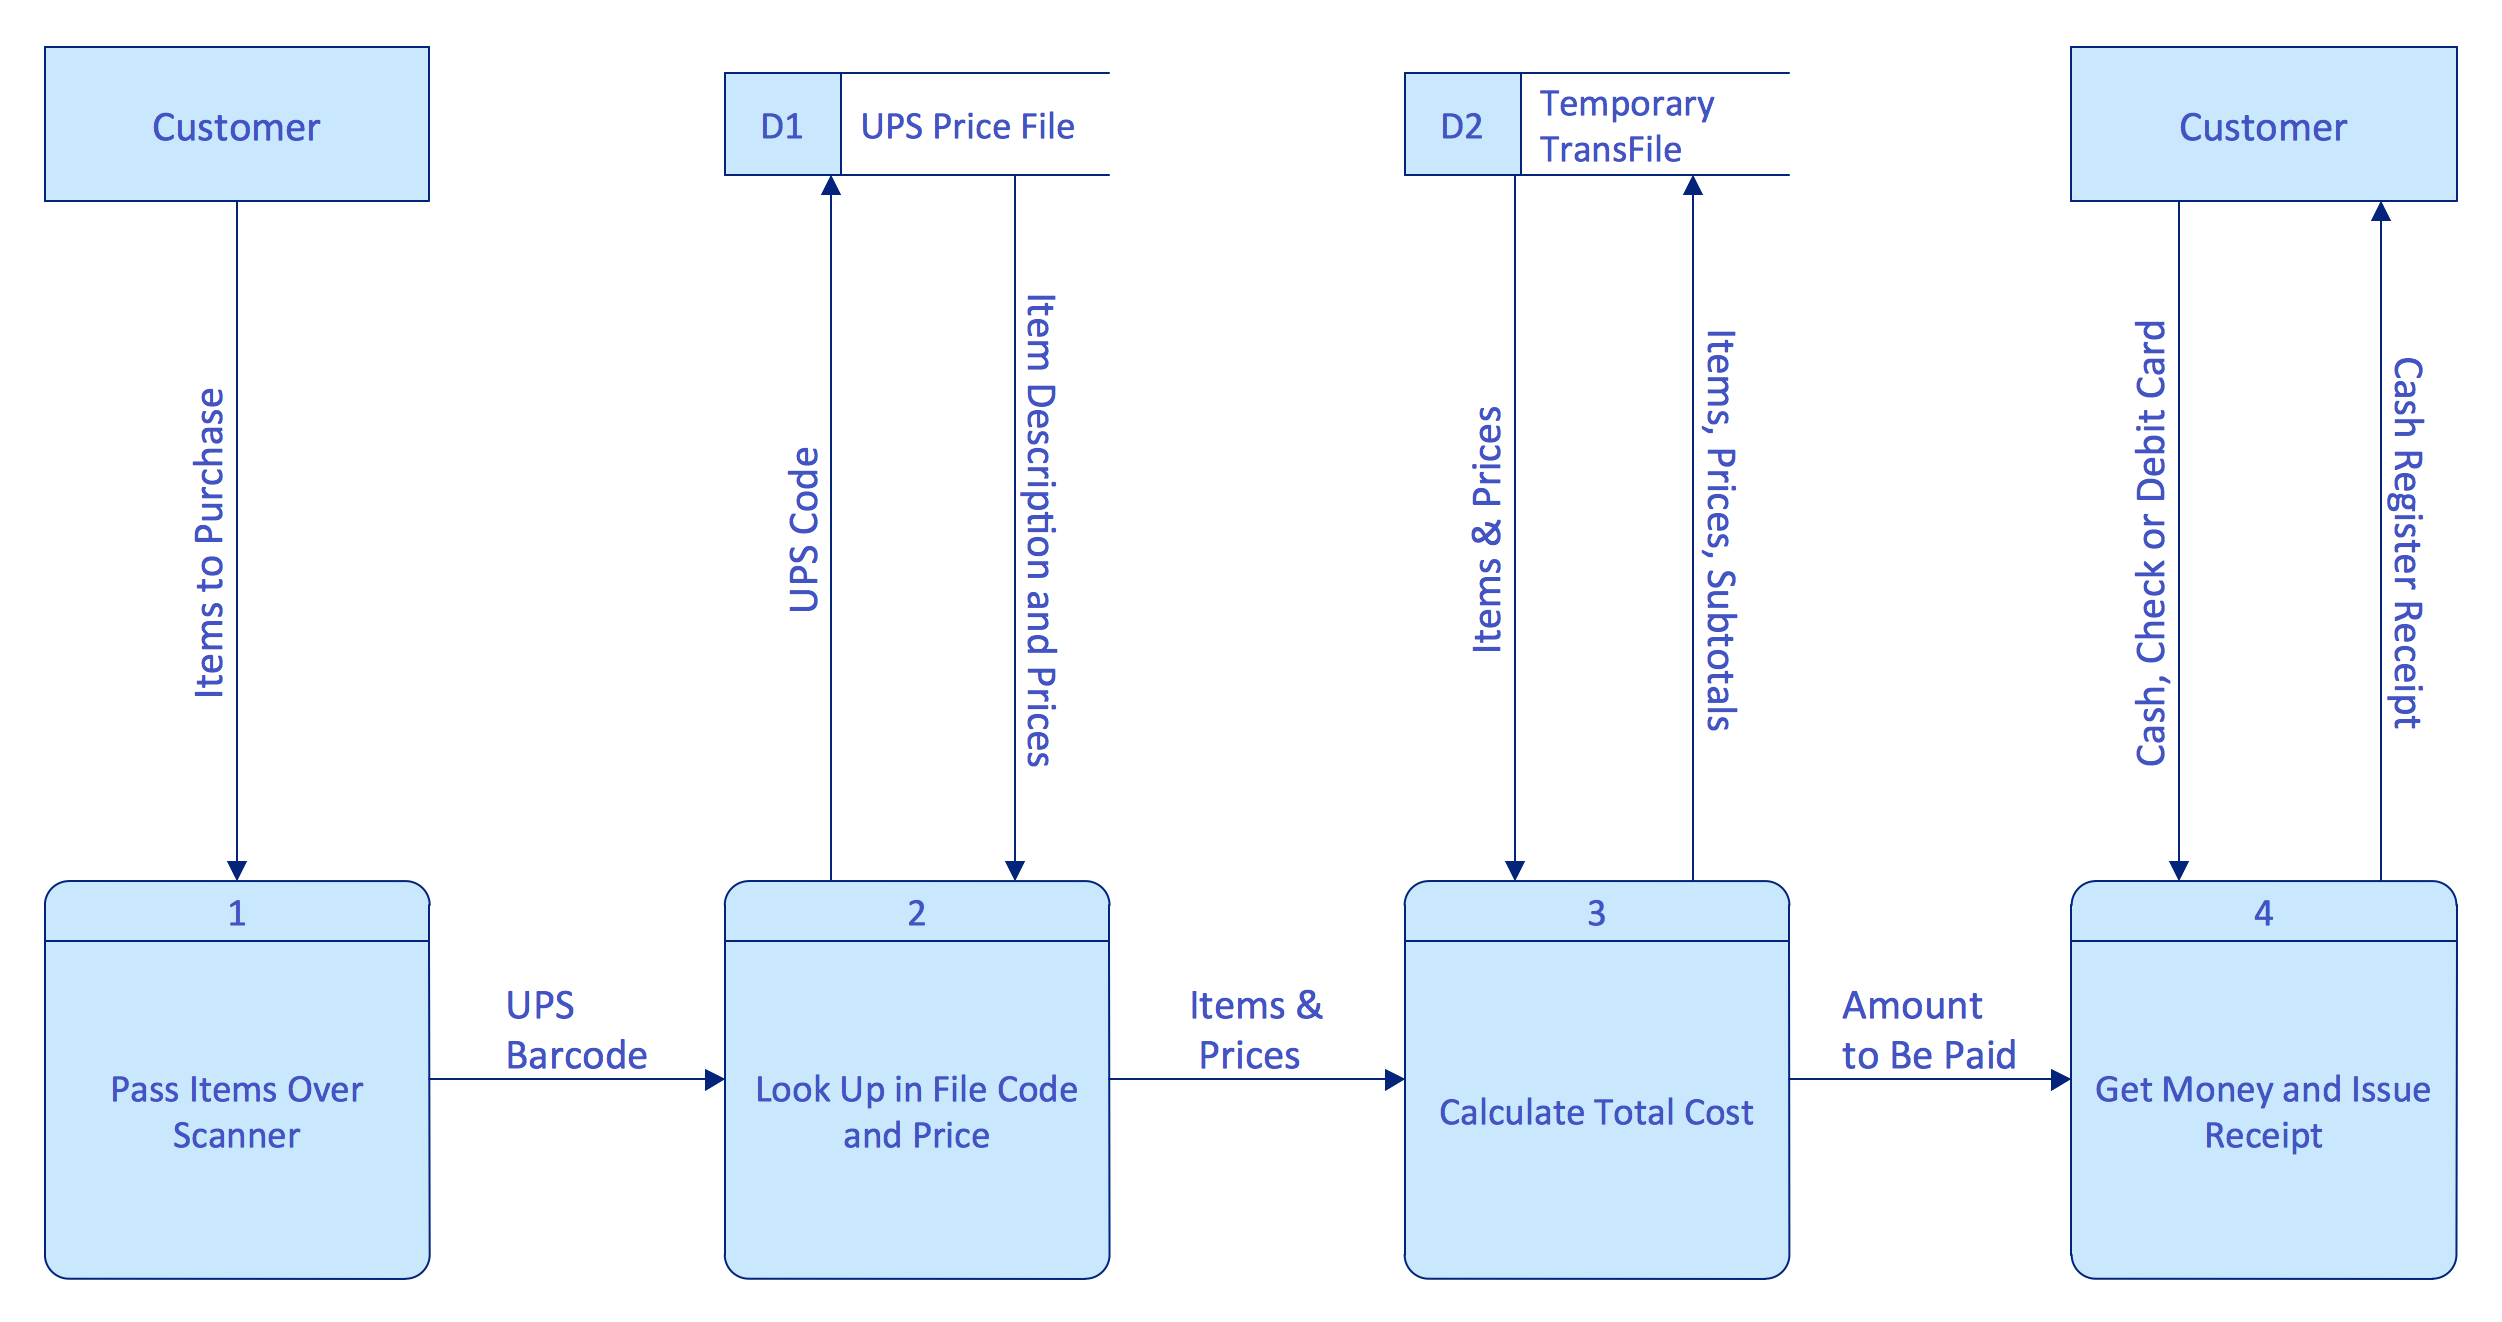
Picture: Software Diagrams
VSM symbols are the best for a production process designing. The entire Value Stream Mapping method uses a graphical representation of the manufacturing process, factors' pros and cons, that all stakeholders can easily understand. Value Stream Mapping is a graphical technique that provides possibilities to improve analysis of a manufacturing process, at the stage of the transferring information or materials that required to deliver a product or service to the customer.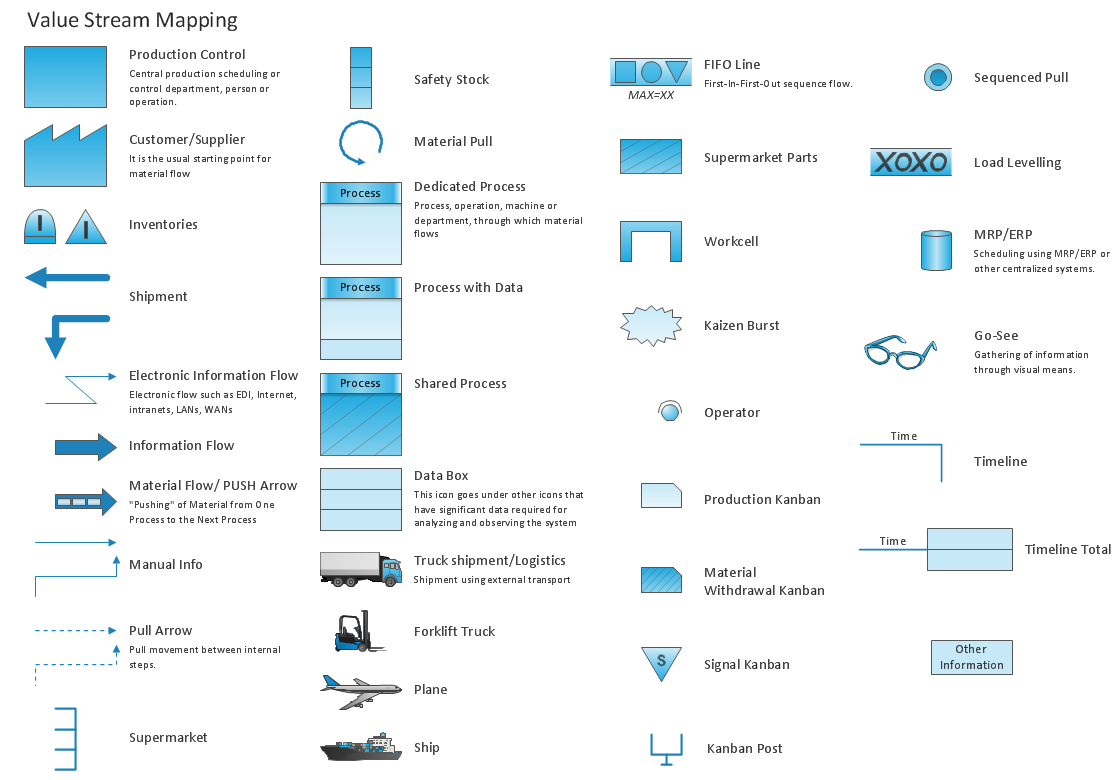
Picture: Value Stream Mapping Symbols
Related Solution:
The Rapid UML solution provides diagram examples, templates and vector stencils libraries for quick and easy drawing all types of UML 2.x and 1.x diagrams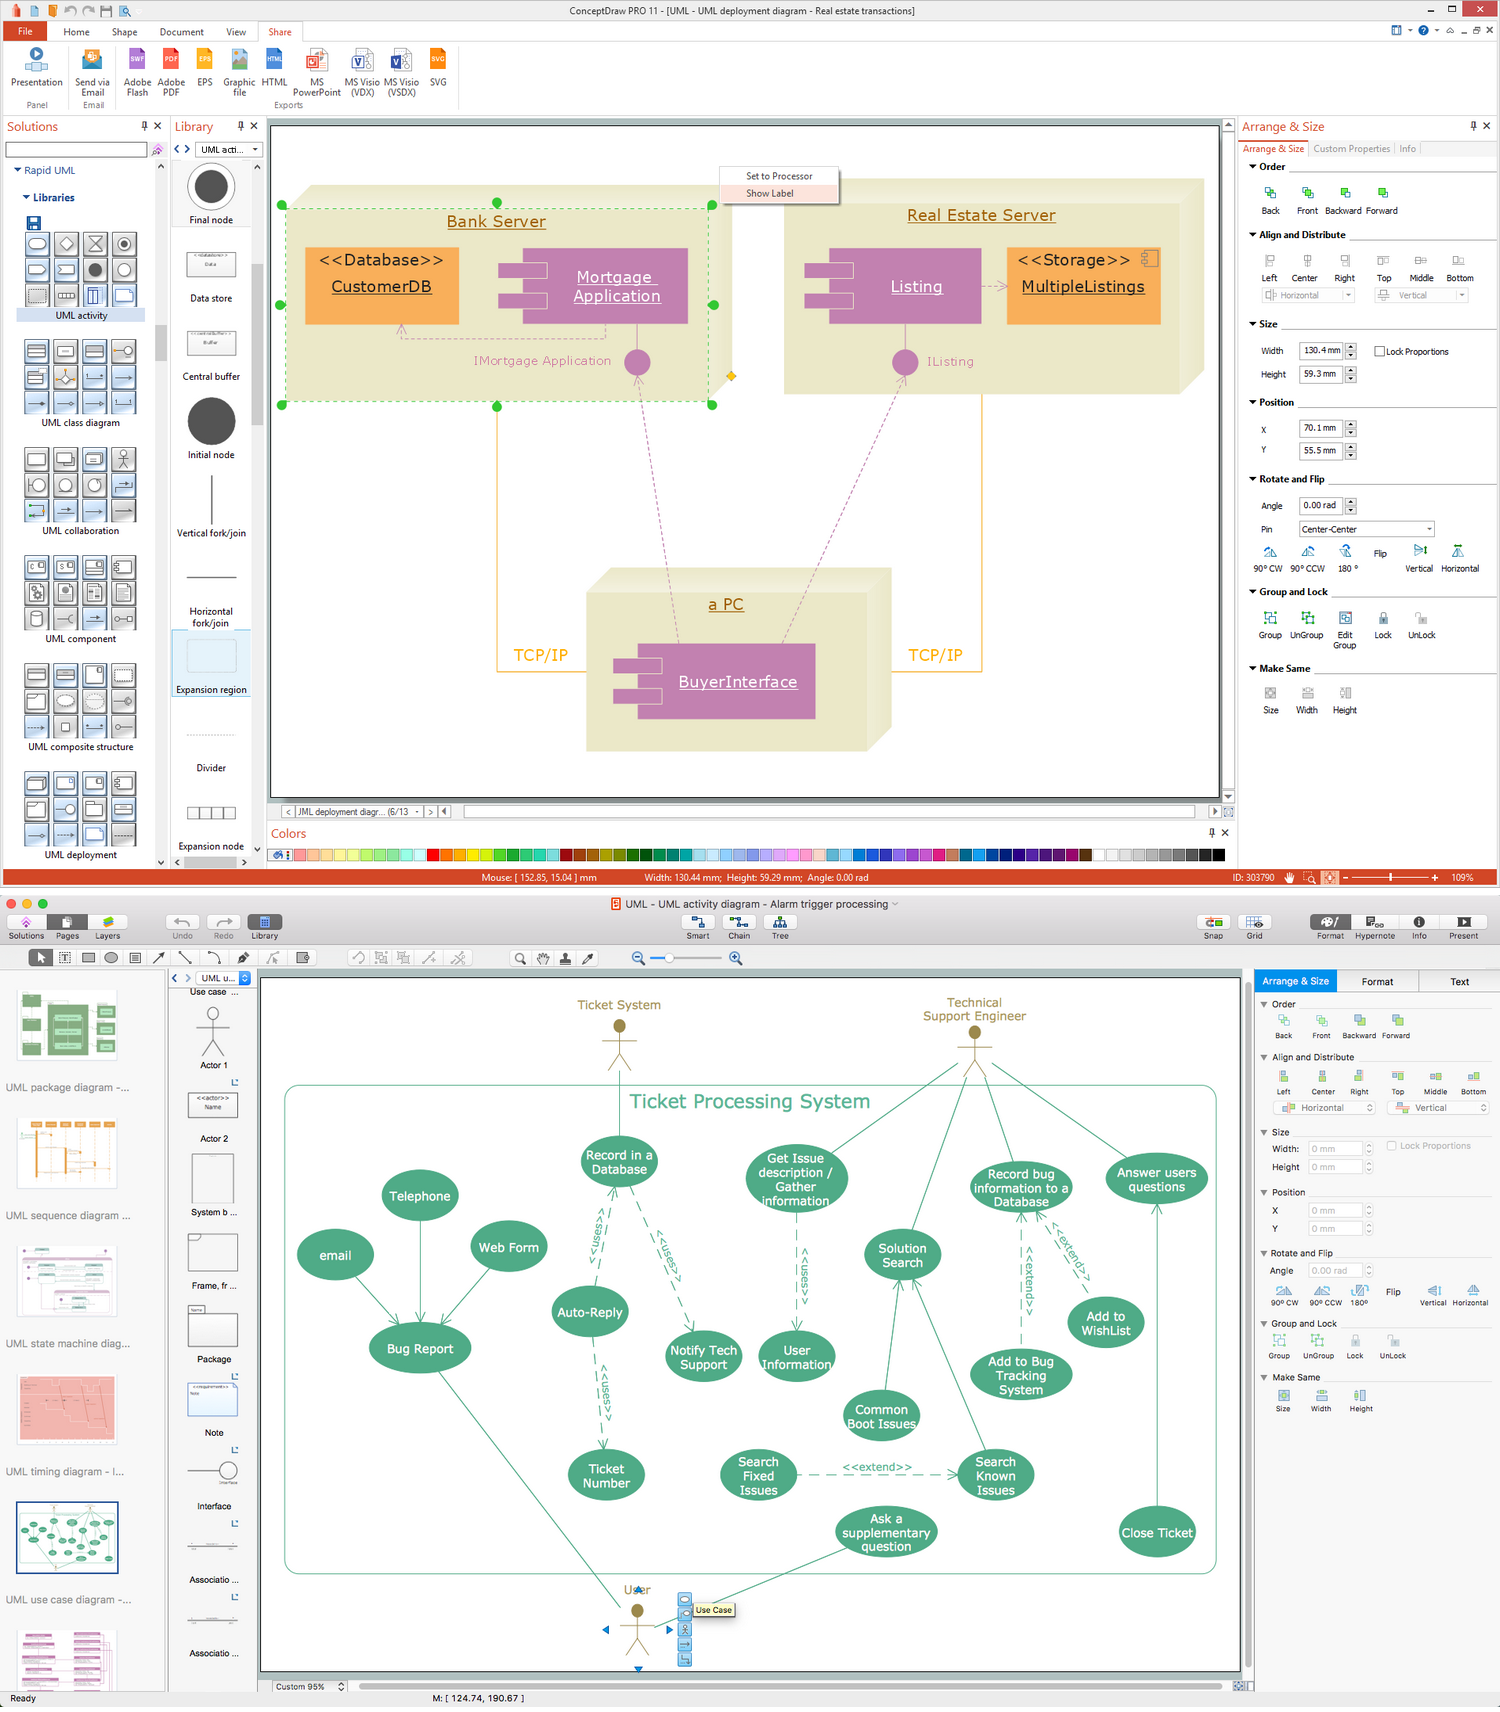
Picture: UML Business Process
Related Solution:
To maintain big and complex mechanical systems, you need an appropriate education and tools. It’s needless to say that mechanical drawing is important part of any industrial project. There are a lot of standard symbols depicting valves, pumps, motors, etc.
This drawing illustrates the content of the Fluid Power Equipment library provided by the ConceptDraw Mechanical Engineering solution. The solution is composed from the 8 libraries, containing about 500 elements related to mechanical engineering visualization. it will be helpful for drawing various schemes, charts and blueprints of pneumatic, and hydraulic equipment or other drawing related mechanical engineering. All drawings can be freely resized without loss of quality due to the vector graphics components of its facilities.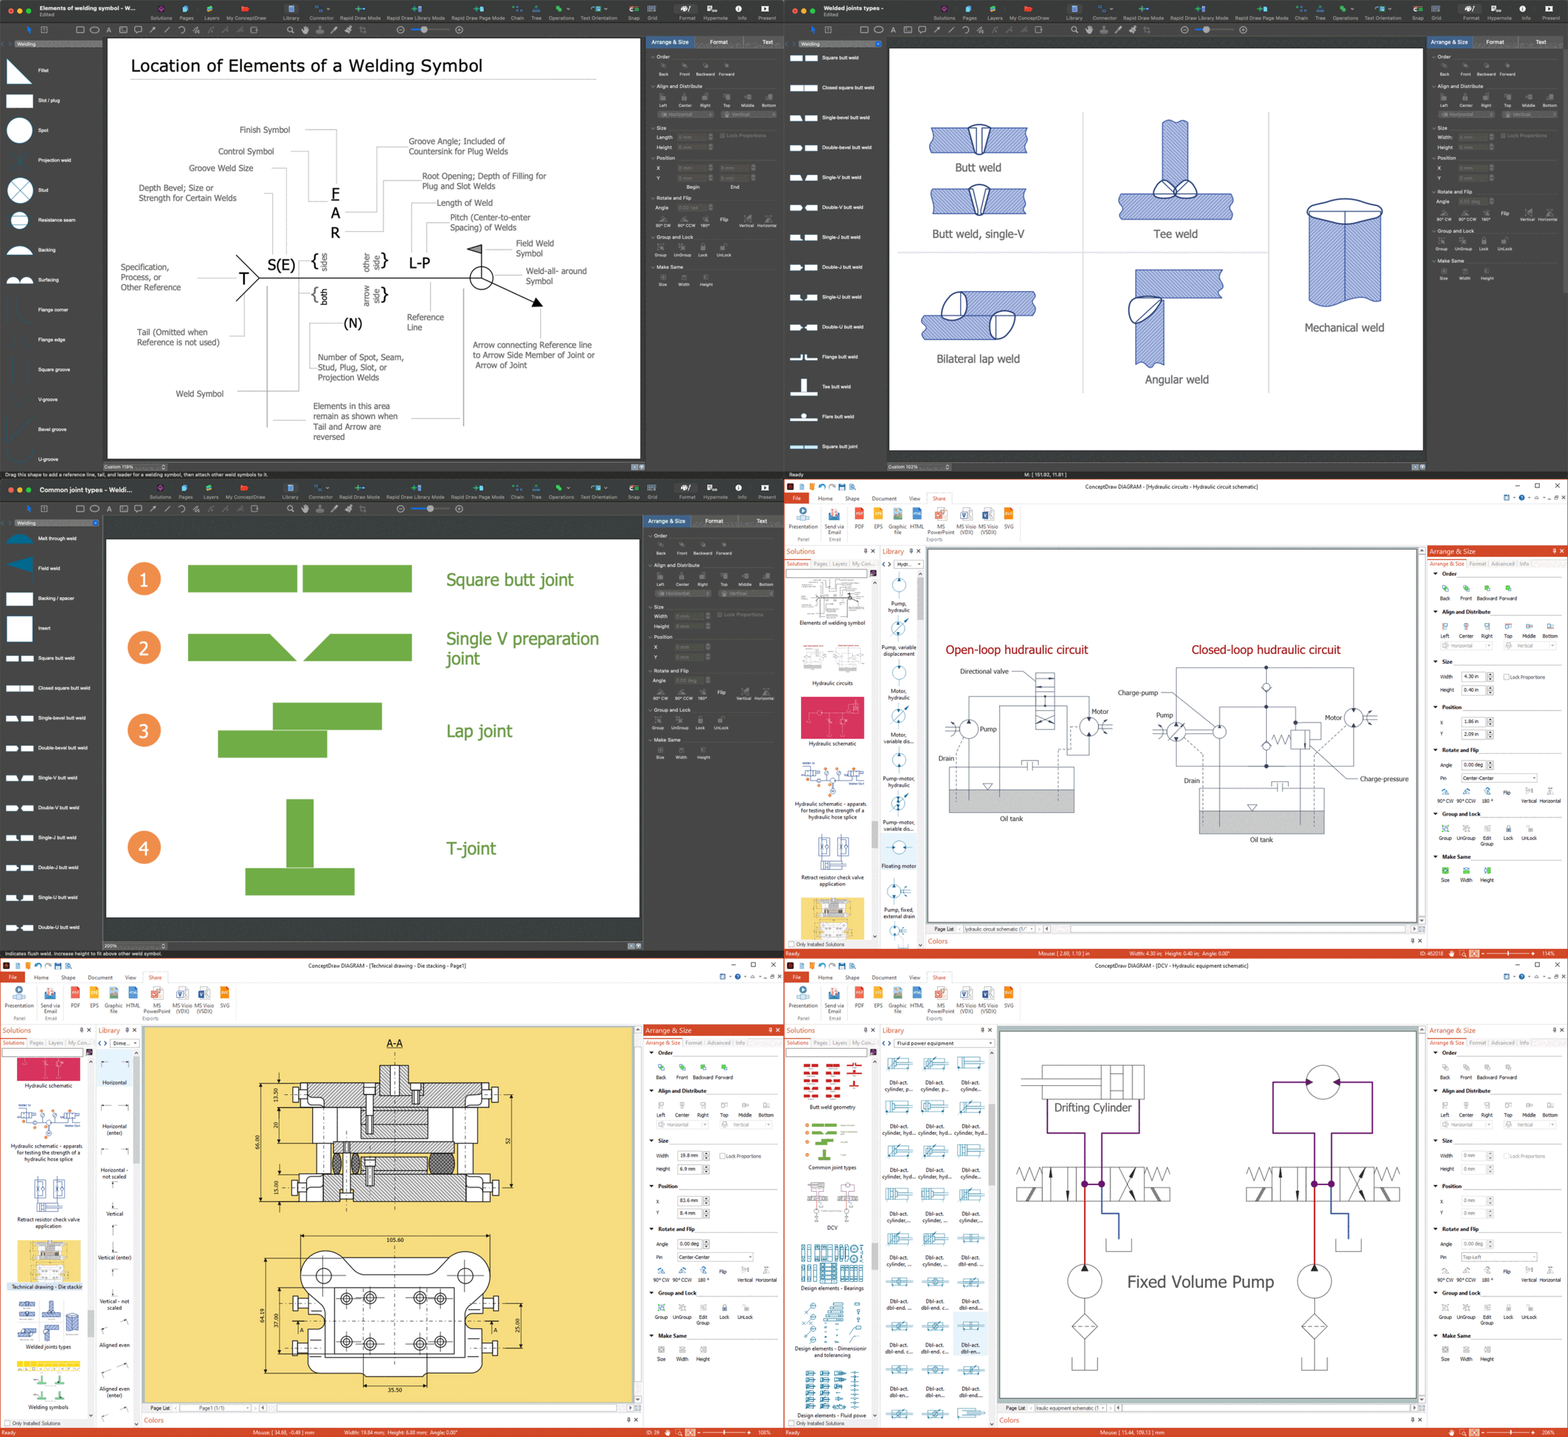
Picture:
Mechanical Drawing Symbols F.A.Q.
How to Use Mechanical Engineering Design Software
Related Solution:
Any business process consists from a number of tasks carrying out the certain business goal. It is useful to diagram business processes to ensure that they are as foolproof, logical and sequential as possible. This business process diagram describes a typical booking process flow by the example of a cab booking process. It can be used as a roadmap for any booking system implementation. Diagramming a business process allows you to look at the entire project and take into account all types of possible scenarios. Business process diagram helps you investigate and clarify the process thoroughly so that you can find out how it can be improved. Business process diagram supports team communications by ensuring that each process element is clear and everyone in the team is on the same page.
Sometimes your company brings you less profit than you expect it to be, and it’s difficult to reveal the causes. Maybe it’s time to learn new technologies, because business diagram are easily developed by means of special software, so you won’t make any extra effort. In return, you will increase your productivity and get more done in a less time.
Picture: Business Diagram Software
Related Solutions:
A voltage source is a two terminal device which can maintain a fixed voltage. An ideal voltage source can maintain the fixed voltage independent of the load resistance or the output current. However, a real-world voltage source cannot supply unlimited current. A voltage source is the dual of a current source. Real-world sources of electrical energy, such as batteries, generators, and power systems, can be modeled for analysis purposes as a combination of an ideal voltage source and additional combinations of impedance elements.
26 libraries of the Electrical Engineering Solution of ConceptDraw DIAGRAM make your electrical diagramming simple, efficient, and effective. You can simply and quickly drop the ready-to-use objects from libraries into your document to create the electrical diagram.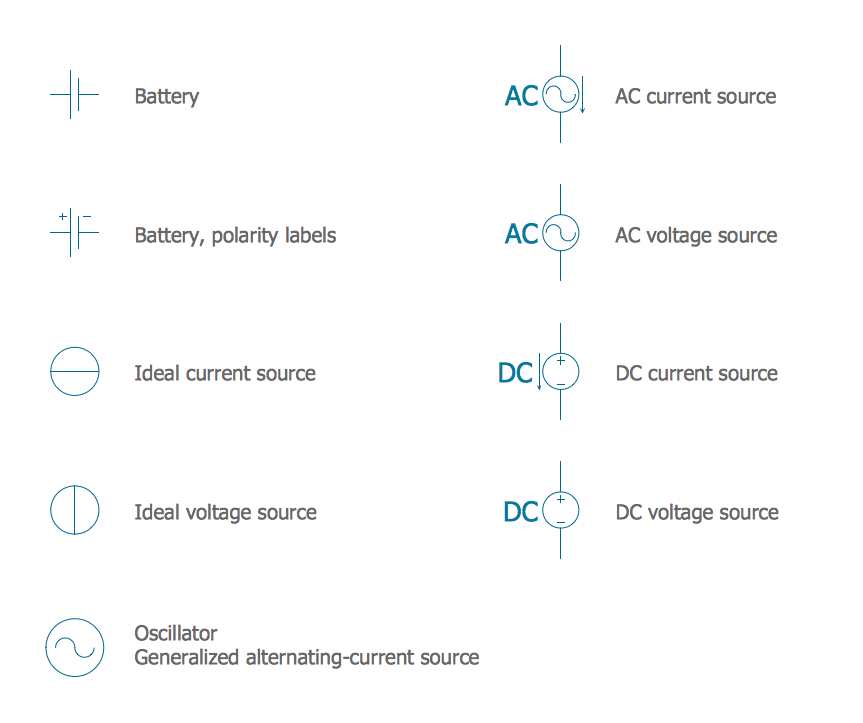
Picture: Electrical Symbols — Power Sources
Related Solution:
An integrated circuit (IC) is a chip or microchip that consists of a substrate created from semiconductor material and thousands or millions of tiny electronic components installed on it. ConceptDraw DIAGRAM software with included Digital Electronics solution allows you to choose from an enormous number of vector electrical symbols, integrated circuits, logic gates, connections, flip flop symbols. Collection of the pre-made symbols and also an included set of professionally designed samples are useful to create Integrated circuit schematics of various kinds in minutes.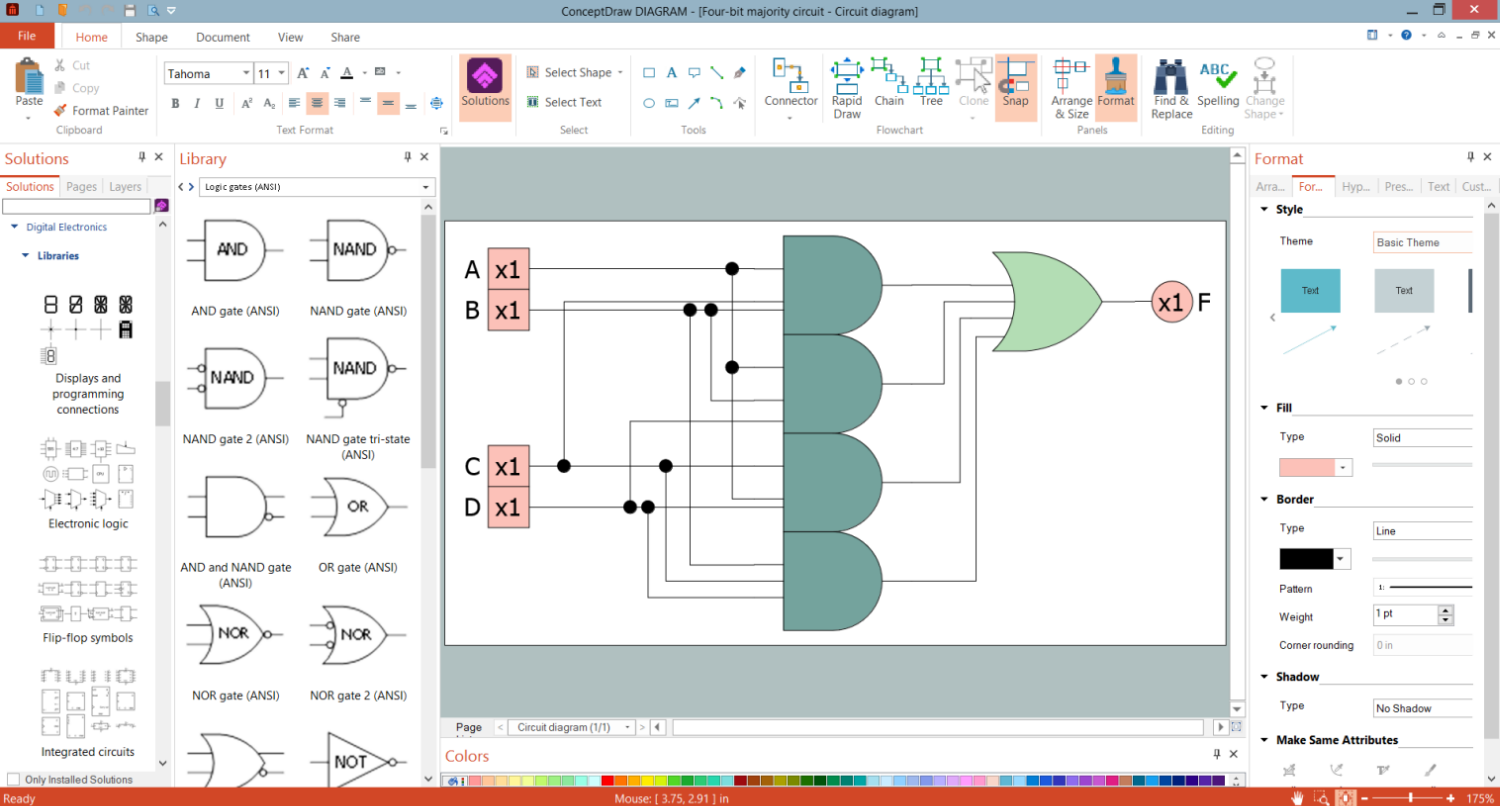
Picture: Integrated Circuit
Entity Relationship Diagram (ERD) is the world-known way to show the logical structure of databases in visual manner. The best software tool for drawing Entity-Relationship Diagram is ConceptDraw DIAGRAM vector graphics software with Entity-Relationship Diagram (ERD) solution from Software Development area which gives the ability to describe a database using the Entity-Relationship model. The vector graphic diagrams produced using this solution can be successfully used in whitepapers, presentations, datasheets, posters, or any technical materials.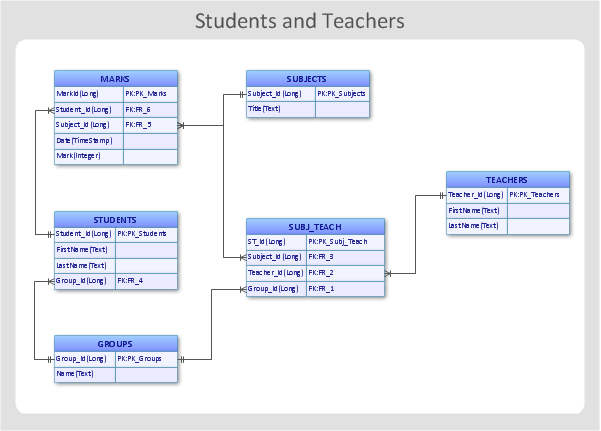
Picture: Entity-Relationship Diagram
Related Solution: