Made with
ConceptDraw
DIAGRAM 18

Simple Flow Chart


ConceptDraw DIAGRAM diagramming and vector drawing software extended with Flowcharts Solution from the "Diagrams" area of ConceptDraw Solution Park is a powerful tool for drawing Flow Charts of any complexity you need. Irrespective of whether you want to draw a Simple Flow Chart or large complex Flow Diagram, you estimate to do it without efforts thanks to the extensive drawing tools of Flowcharts solution.

Flow Chart Solution

Example 1. Flow Chart Solution

Flowcharts Solution provides 2 libraries with numerous ready-to-use vector objects, predesigned Basic Flowchart template and variety of flow chart samples developed specially for this solution.

Flow Chart Design Symbols

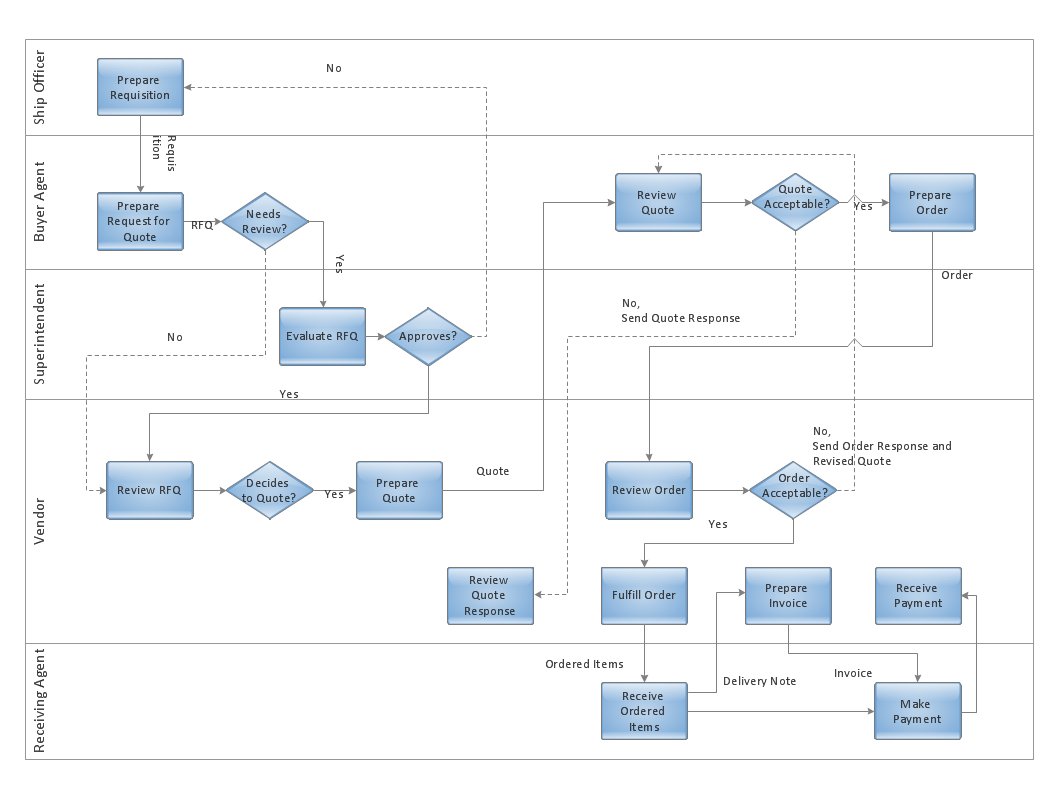
Example 2. Flow Chart Design Symbols

This sample was created in ConceptDraw DIAGRAM software using the Flowcharts Solution. An experienced user spent 5 minutes creating this simple flow chart.

Simple Flow Chart *

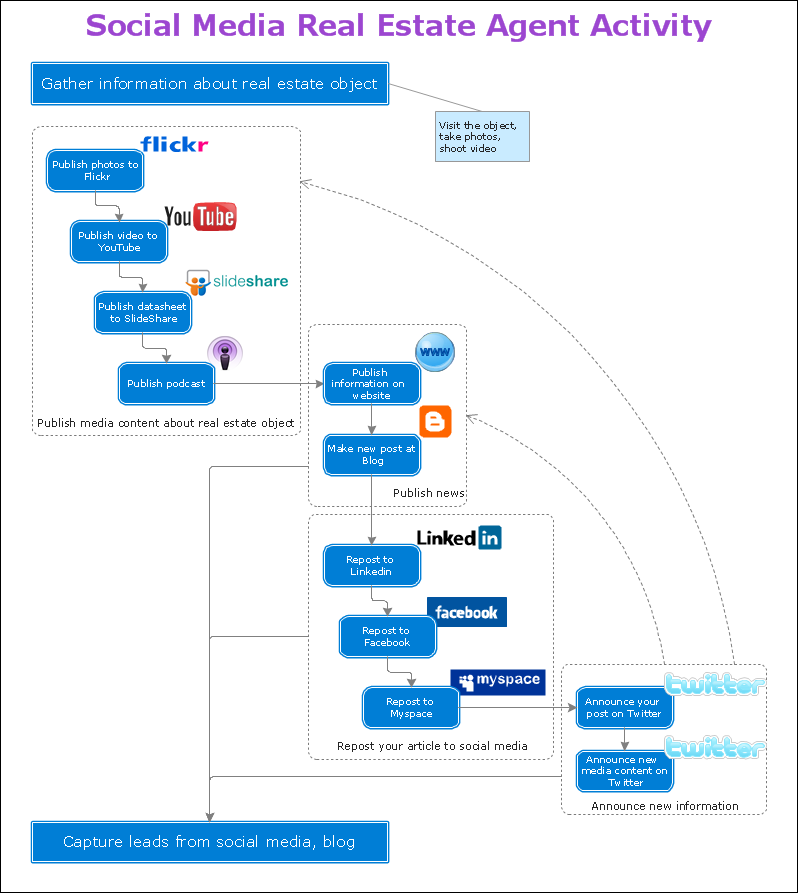
Example 3. Simple Flow Chart

This sample shows the Gravitational Search Algorithm (GSA) that is the optimization algorithm. GSA is based on the law of gravity. It is a swarm based algorithm when all the members execute the operations, exchange the results and produce the global result that allows the system to solve the problem. The objects attract each other by the gravity force, the performance of the objects is measured by their masses. The gravity force causes the movement of all objects to the heavier masses objects. The position of the heavy masses is an optimal solution of the problem.

Use flowchart symbols from Flowcharts Solution for ConceptDraw DIAGRAM software to design your own complex or simple flow chart quick, easy and effective.

All source documents are vector graphic documents. They are available for reviewing, modifying, or converting to a variety of formats (PDF file, MS PowerPoint, MS Visio, and many other graphic formats) from the ConceptDraw STORE. The Flowcharts Solution is available for all ConceptDraw DIAGRAM or later users.


TEN RELATED HOW TO's:
When we start to speak about databases, we must always mention database structure visualization. One of the most common ways to do it is to create an entity relationship diagram, and to put appropriate symbols on it. It is important either for database projecting and for its' future maintenance. Entity Relationship Diagram describes data elements and their relationships within a database. There are a set of special symbols that depict each element of an entity relationship diagram. Entities - represents some stable components such as supplier, employee, invoice, client, etc. Relation symbols show how the entities interact. Attributes define characteristics of the relationships. Attributes can be one-to-one or many-to-many. Physical symbols is used in the physical models. They represent items such as fields, tables, types and keys. ERD physical symbols are the building material for the database. Notation lines are used to illustrate the relationships. The most common method is Crow’s Feet notation. You can use ConceptDraw Entity-Relationship Diagram (ERD) solution to represent a database using the Entity-Relationship model.Entity Relationship Diagram Symbols
Picture: Entity Relationship Diagram Symbols
Related Solution:
Visio Files and ConceptDraw. ConceptDraw DIAGRAM is compatible with MS Visio.VDX formatted files.VDX is Visio’s open XML file format, and it can be easily imported and exported by ConceptDraw DIAGRAM.Visio Files and ConceptDraw *
Picture: Visio Files and ConceptDraw
ConceptDraw DIAGRAM enhanced with Flowcharts Solution is the best flow chart maker online design software. Use it to ✔️ create clear and actionable Flowcharts, ✔️ improve decision-making, ✔️ enhance problem-solving in various scenarios, ✔️ enhance creativity and productivity across industries, ✔️ streamline workflowsFlow Chart Online
Picture: Flow Chart Online
Related Solution:
The purchasing process follows very specific guidelines and includes an purchasing cycle flowchart. Common key elements of purchasing process.How well does Your Purchase Process Flow? *
Picture: How well does Your Purchase Process Flow?
Related Solution:
Building plans are usually very complicated and a hard work to do. It would be nice to use a proper drawing software to facilitate the task. Design a site plan quick and easily with all the stencils and samples from ConceptDraw libraries. This drawing shows content of the ConceptDraw vector libraries related to the site planning and arrangement of the living environment. ConceptDraw delivers about 50 libraries containing near one and a half thousands vector objects that will help you to design territory arrangement plans and make the Site plan sketches. You can use the Parking and Roads library for designing a parking space, or drawing transport management schemes. The Site Accessories library provides a number of objects, that allow you to depict various equipment of vehicle access control, street lamps, benches, trash cans and other items of the street environment.Building Drawing Software for Design Site Plan
Picture: Building Drawing Software for Design Site Plan
Related Solution:
ConceptDraw DIAGRAM is a powerful tool that helps you create professional looking cross-functional flowcharts with the well-designed objects. ConceptDraw DIAGRAM - Drawing Software for Vertical Cross Functional Flowchart. ConceptDraw allows you to focus on work, not the drawing process. ConceptDraw Arrows10 Technology allows to draw connectors with smart behavior that gives flexibility to you during work process.Vertical Cross Functional Flowchart *
Picture: Vertical Cross Functional Flowchart
Easy charting software comes with beautiful chart templates and examples. This makes it easy to create professional charts without prior experience.Chart Templates *
Picture: Chart Templates
Big and complex projects sometimes need some simplification of plans and schedules. That's why Program Evaluation and Review Technique was invented and first implemented in 1958. You can create PERT diagrams effortlessly with ConceptDraw DIAGRAM and share them with your colleagues. Program Evaluation Review Technique (PERT) is a method that is used to assess and analyze projects. PERT is a valuable tool for the project management practice. PERT gives an assessment and analysis of the time needed to the project completion. A PERT chart is a visual tool that delivers a graphical view of a project timeline. It is used to display the sequences and dependences of project tasks necessary to complete a project. ConceptDraw DIAGRAM delivers the possibility to build a PERT along with other diagrams applied to assist management process by using its Seven Management and Planning Tools solution.Program Evaluation and Review Technique <br>(PERT) with ConceptDraw DIAGRAM  *
Picture: Program Evaluation and Review Technique (PERT) with ConceptDraw DIAGRAM
Related Solution:
This sample shows the Influence Diagram. It was created in ConceptDraw DIAGRAM diagramming and vector drawing software using the Basic Diagramming Solution from the Universal Diagramming area of ConceptDraw Solution Park. Influence diagram represents the directed acyclic graph with three types of nodes and three types of arcs that connect the nodes. Decision node is drawn as a rectangle, Uncertainty node is drawn as an oval, Value node is drawn as an octagon.Influence Diagram *
Picture: Influence Diagram
Related Solution:
The Total Quality Management Diagram solution helps you and your organization visualize business and industrial processes. Create Total Quality Management diagrams for business process with ConceptDraw software.TQM Diagram Example *
Picture: TQM Diagram Example
Related Solution:
ConceptDraw
DIAGRAM 18