Pie Chart Software
A common enough method of graphic representation of the structure of statistical collections is a pie chart, as the whole idea is very clearly expressed in a circle, which represents the entire set. The relative magnitude of each value is represented as a circle sector, area of which corresponds to the contribution of this value in the sum of values. This type of diagramming is convenient to use when you need to show the value of each share in the total volume. Sectors may be depicted in a general circle or be separately arranged at a small distance from each other.
Pie charts are widely used in the reports, as they are visually appealing. The other side of the coin is, however, that pie charts are very simplified chart type that can not provide data well. Consider the possibility to use pie charts only after data processing, which results in a small number of data points.
For pie charts, each data group is displayed in a separate slice on the diagram. It is necessary for a pie chart to add at least one data field and one category field. If you add more than one data field to the pie chart, two data fields are displayed in the same graph.

Pic 1. Pie Chart Examples
While calculating the pie chart shares some values like empty, negative or zero are not taken into account. Therefore, these values are not displayed in the pie chart. If you want to visualize the values of these types in the diagram, you should choose a chart type that is different from a pie chart.
Unlike most other types of charts, the legend to the pie chart shows the individual data points instead of individual series.
At least two values are required for a pie chart to allow valid comparison between the two proportional shares.
If a pie chart contains only one color, make sure that you have a category field to group by. If the pie chart contains no categories, it performs statistical processing of the data fields values to get one a value for display.
To design pie and donut charts use ConceptDraw DIAGRAM diagramming and vector drawing software extended with Pie Charts solution from Graphs and Charts area of ConceptDraw DIAGRAM Solution Park.

Pic 2. Pie Chart in ConceptDraw STORE
The Pie Charts solution provides templates, samples and a library of vector stencils for quick and easy drawing pie and donut charts.
The shapes library Pie Charts contains ready-to-use predesigned pie and donut chart objects you can simply drop into your document, quickly set up data and obtain professional looking different types of pie and donut charts: percentage and absolute values pie charts, separated pie and exploded pie charts, pie charts with shifted slices, percentage and absolute values donut (doughnut, ring) charts, arrow ring charts.

Pic 3. Pie Chart Software
ConceptDraw DIAGRAM software with Pie Charts solution helps to create pie and donut charts for effective displaying proportions in statistics, business and mass media for composition comparison, i.e. for visualization of part percentage inside one total.

Pic 4. Pie Chart Library
Free Download Pie Chart Software and View All Examples
Using pie charts always leaves a free space on your page or slide. You can use this space to add illustrations or text labels provide your audience with additional information which may help your audience understand the subject.

Pic 5. Percentage pie chart. DA determinations
This example was created in ConceptDraw DIAGRAM using the Pie Charts Library from the Pie Charts Solution. An experienced user spent 5 minutes creating this sample.
TEN RELATED HOW TO's:
Visual information is easier to perceive. You can teach even a child to make diagrams with a good flowchart example that would be interesting for it. Flowcharts can be fun, it’s not about business processes or programming algorithms.
This flowchart shows step by step process of manufacturing of Nixtamal The product which is obtained by processing maize with calcium hydroxide. We must assume that the Aztecs were very fond of this product, if the recipe of its production came to our times. This flow chart was designed using ConceptDraw DIAGRAM with its solution for designing flowcharts of various types, sizes and purposes. ConceptDraw Flowcharts solution consists from the library of flowchart symbols, containing the set vector objects. Also there are a lot of diverse templates and samples of flow charts.
Picture: Flowchart Examples and Templates
Related Solution:
ConceptDraw DIAGRAM is a Mac OS X and Windows software. Numerous vector stencils, samples and templates created by designers are included in the basic package. This is classic flowchart maker which exactly follows the industry standards using flowchart symbols geathered during a ten years into solution park.
Picture: Flowchart Software
Related Solution:
The excellent possibility to create attractive Cross Functional Flowcharts for step-by-step visualization the operations of a business process flow of any degree of detailing is offered by ConceptDraw’s Cross-Functional Flowcharts solution. The extensive selection of commonly used vector cross functional flowchart symbols allow you to demonstrate the document flow in organization, to represent each team member’s responsibilities and how processes get shared or transferred between different teams and departments.
Picture: Cross Functional Flowchart Symbols
Related Solution:
You need design the Functional Block Diagram and dream to find the useful tools to draw it easier, quickly and effectively? ConceptDraw DIAGRAM offers the Block Diagrams Solution from the "Diagrams" Area which will help you!
Picture: Functional Block Diagram
Related Solution:
It can be tough to get straight into business papers and processes.Otherwise, you can learn how to create flowcharts for an accounting information system and visualize these documents. Accounting diagrams are clear and easy to understand for all the participants of the process.
There are symbols used for creating accounting flowcharts using ConceptDraw DIAGRAM and its Accounting Flowcharts solution. Accounting flow charts are a special kind of flow charts. Actually a variety of flowcharts are often used to facilitate many aspects of a workflow of accounting department. Accounting flowcharts are utilized to support creating accounting documentation, to depict positions responsible for fulfillment of each phase of accounting workflow.
Picture: How to Create Flowcharts for an Accounting Information System
Related Solution:
A layout is a way that furniture is arranged in some place. It’s not difficult to develop a store layout using software with tons of templates and libraries with vector shapes of furniture, doors, walls etc. Create a plan in five minutes and have more time to implement it.
Designing the floor plan for a new store is very important step for a small business. Well thought out and well-done floor plan is the foundation of the store layout. It should provide a basis through which to make out and organize everything else. Sometimes a small stores have a small floor space, so well thought out arrangement of furniture and commercial equipment is crucial to the success of the business. By using the ConceptDraw Floor Plans solution you can make a floor plan for your store quickly and effortlessly.
Picture: Store Layout Software
Related Solution:
Visualizing sports statistics becomes as easy as never before with ConceptDraw DIAGRAM software extended with the Winter Sports solution. This solution delivers a complete set of winter sports illustrations, samples and templates you may use to visualize any kind of sports statistics in minutes.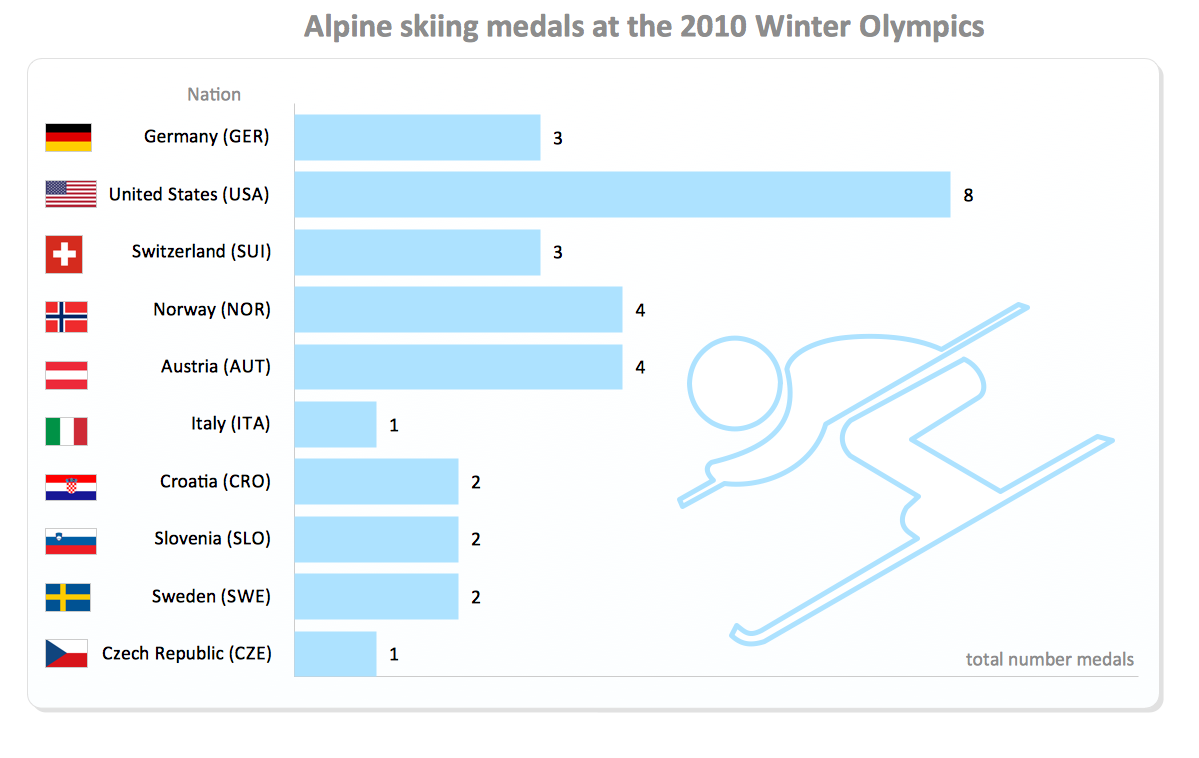
Picture: Winter Sports. Illustrations and Visualize Statistics
Related Solution:
Home remodeling is something that many people face at one point or the other. The first part of any home remodeling is to create a new home plan. At first, it may seem a daunting and costly endeavor, but to take it on yourself, you just need to choose the right home remodeling software. Digital drawing software, such as ConceptDraw DIAGRAM , includes home plan examples to help you get started, as well as multiple advanced and powerful options, and an intuitive interface to go with them.
People who want to make changes in their houses planning have previously prepare a plan of rebuilding, of house, apartment or any other construction. If somebody desires to change anything in the interior design he also requires a plan, as it’s handy to see on the plan the coming result and then begin to implement it. All these tasks will be solved better with ConceptDraw DIAGRAM and its solution for Building Plans. You will design professional looking Home Plans quick and easy using the vector libraries, templates and samples, supplied with Solution.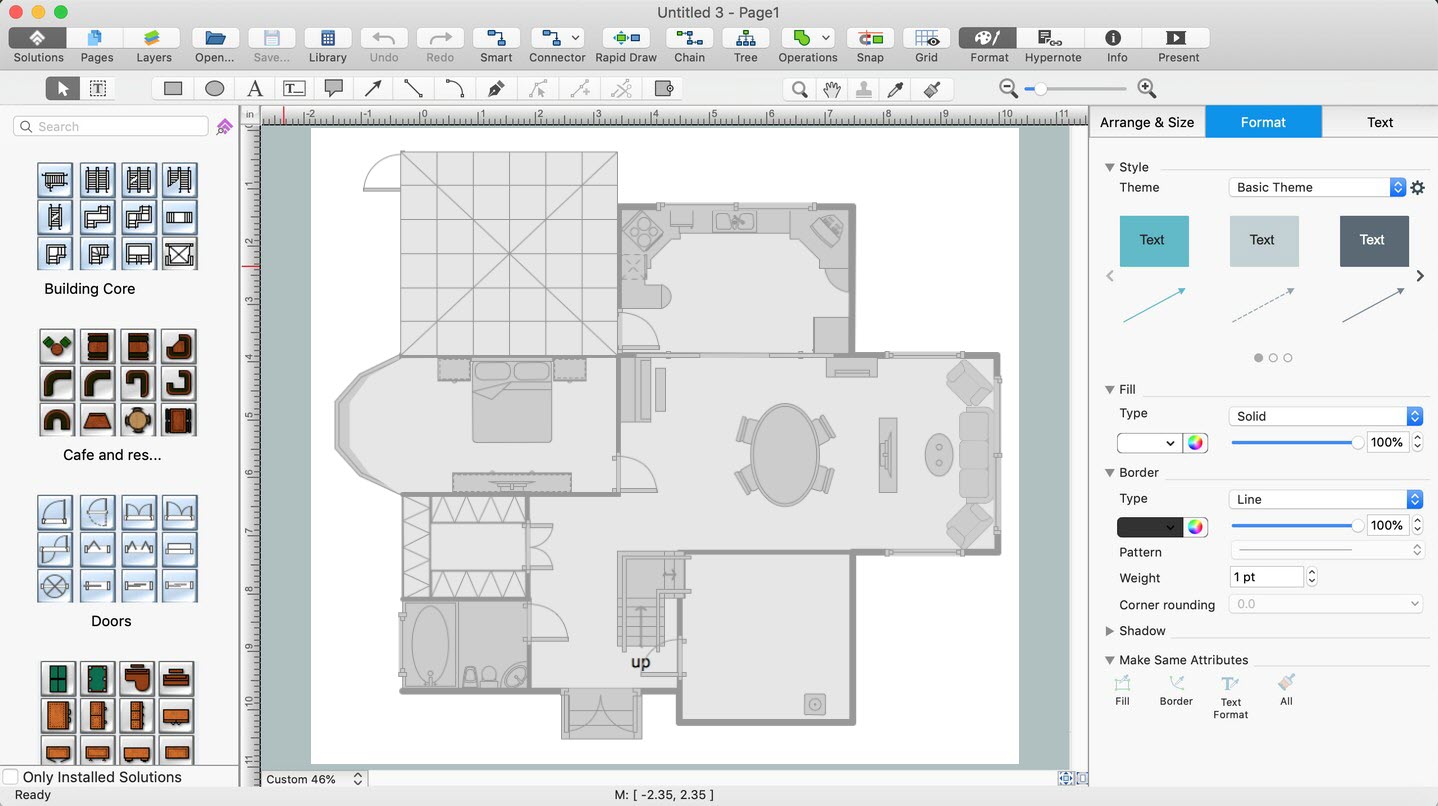
Picture: Home Remodeling Software. Home Plan Examples
Related Solution: