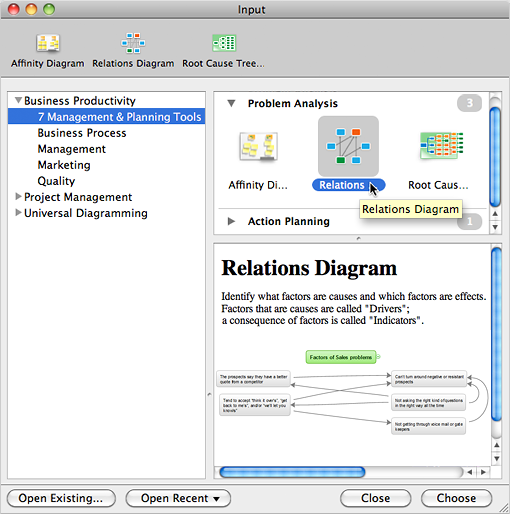
Relations Diagram
Relations DiagramIdentify how factors influence each other. Factors mostly influencing called “Drivers” Primarily affected factors called “Indicators”. Problem solving further focuses on changing driver factors by corrective actions. Indicator factors help establish KPI (Key Performance Indicators) to monitor changes and the effectiveness of corrective actions in resolving a problem. How to create Relations Diagram
Identify what factors are causes and which factors are effects. |

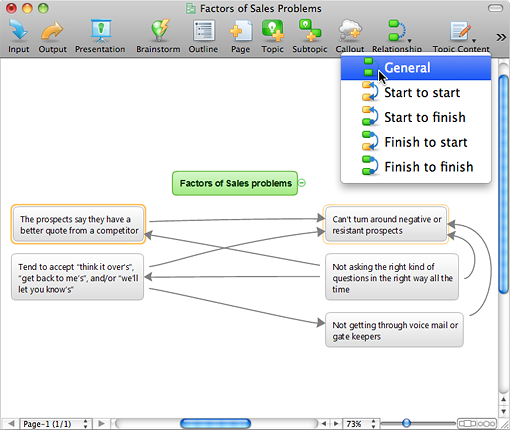
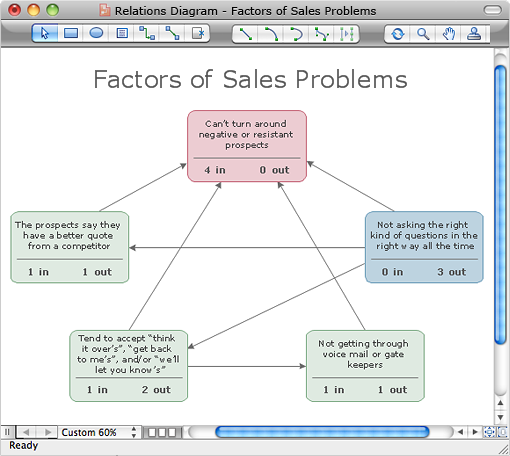

Example 1. Factors of Sales Problems
The Benefits for ConceptDraw MINDMAP Brainstorming Software
- ConceptDraw MINDMAP is effective for brainstorming, designing mind maps, idea generating, creative and lateral thinking, creativity and problem solving.
- ConceptDraw MINDMAP is ideal for team and personal work in Business, Marketing and Project Management.
- The libraries with large quantity of vector objects help to illustrate your mind maps and to make them bright, visual and comprehensible.
- Use of View Navigator tool lets create presentations from a mind map: you can simply select the map parts you want to present, sequence your slides, and preview the presentation.
- ConceptDraw MINDMAP provides wide capabilities of importing and exporting in various formats: Microsoft PowerPoint, Microsoft Word, MS Excel, Mindjet MindManager, image, HTML, PDF file.
NINE RELATED HOW TO's:
ConceptDraw DIAGRAM software extended with Fishbone Diagrams solution from the Management area of ConceptDraw Solution Park is perfect for Cause and Effect Diagram creating. It gives the ability to draw fishbone diagram that identifies many possible causes for an effect or a problem. Causes and Effects are usually grouped into major categories to identify these sources of variation. Causes and Effects in the diagram show relationships among various factor. Fishbone diagram shows factors of Equipment, Process, People, Materials, Environment and Management, all affecting the overall problem.
Picture: Cause and Effect Diagram
Related Solution:
ConceptDraw DIAGRAM extended with Data Flow Diagrams solution is the best diagramming and vector drawing software for quick and easy designing the Data Flow Diagram Example of any complexity.
Picture: Data Flow Diagram Example
Related Solution:
By filling in this template, it is easy to quickly prepare a presentation about any quality process in your company.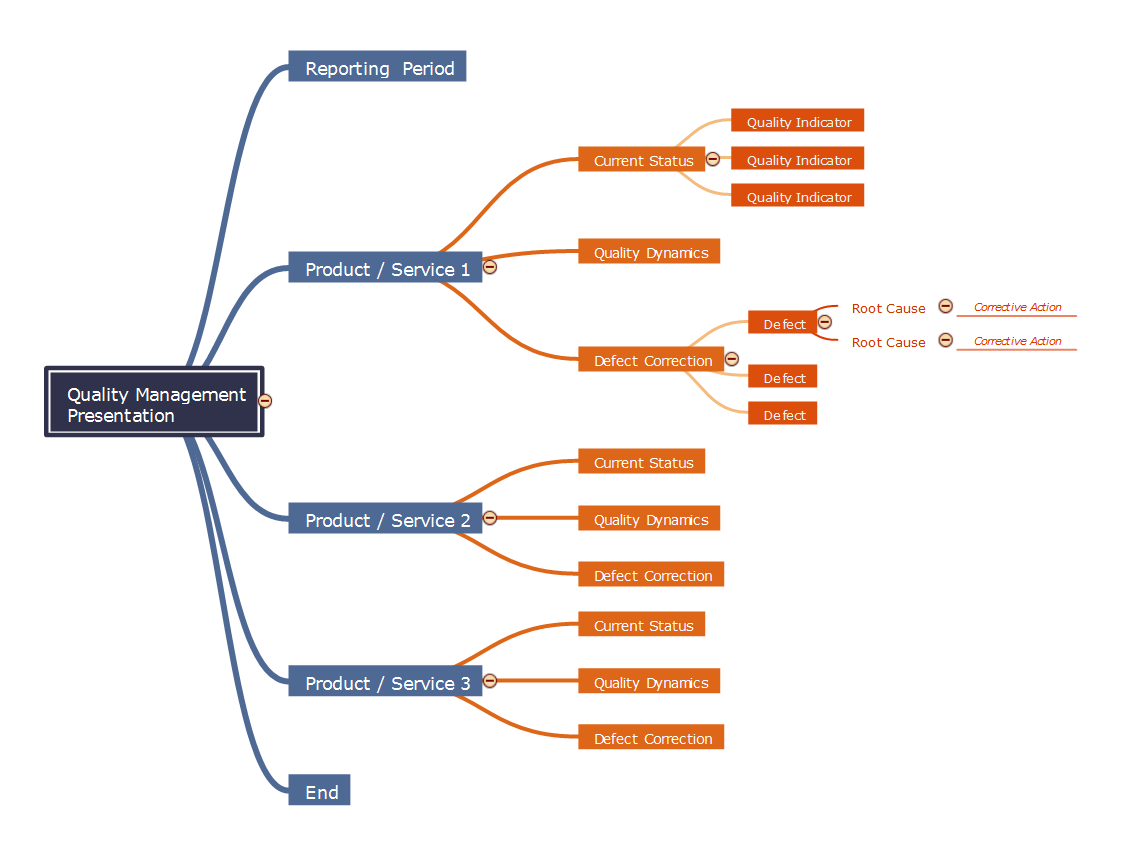
Picture: Quality management presentation
Related Solution:
ConceptDraw DIAGRAM diagramming and vector drawing software extended with Chemistry solution from the Science and Education area is a powerful chemistry drawing software that is ideal for quick and easy designing of various: chemistry drawings, scientific and educational chemistry illustrations, schemes and diagrams of chemical and biological lab set-ups, images with chemical formulas, molecular structures, chemical reaction schemes, schemes of labware,
that can be then successfully used in the field of science and education, on various conferences, and so on.
Picture: Chemistry Drawings
Related Solution:
UML Activity Diagram illustrates the business and operational step-by-step workflows of components in a system and shows the overall flow of control. You can use the appropriate stencils of UML notation from UML Activity library with 37 objects. ConceptDraw is ideal for software designers and software developers who need to draw UML Activity Diagrams.
Use ConceptDraw DIAGRAM diagramming and vector drawing software enhanced with Rapid UML solution from ConceptDraw Solution Park to create your own UML activity diagrams that show the business and operational workflows of components and overall flow of control in your systems. Such software provides coloring UML diagrams for various purposes and simplifying work of the engineers.
Picture: UML Activity Diagram
Related Solution:
Collaborating with co-workers is very important, not only in order to get things done effectively, but also to keep in touch with the outside world. Great way for business collaboration is Skype.
Picture: Online Collaboration via Skype
Related Solution:
Venn diagrams are illustrations used in the branch of mathematics known as set theory. They show the mathematical or logical relationship between different groups of things (sets). A Venn diagram shows all the possible logical relations between the sets.
Picture: Venn Diagram Examples for Problem Solving.Venn Diagram as a Truth Table
Related Solution:
Digital electronics or digital (electronic) circuits are electronics that handle digital signals – discrete bands of analog levels – rather than by continuous ranges (as used in analogue electronics). All levels within a band of values represent the same numeric value. Because of this discretization, relatively small changes to the analog signal levels due to manufacturing tolerance, signal attenuation or parasitic noise do not leave the discrete envelope, and as a result are ignored by signal state sensing circuitry.
26 libraries of the Electrical Engineering Solution of ConceptDraw DIAGRAM make your electrical diagramming simple, efficient, and effective. You can simply and quickly drop the ready-to-use objects from libraries into your document to create the electrical diagram.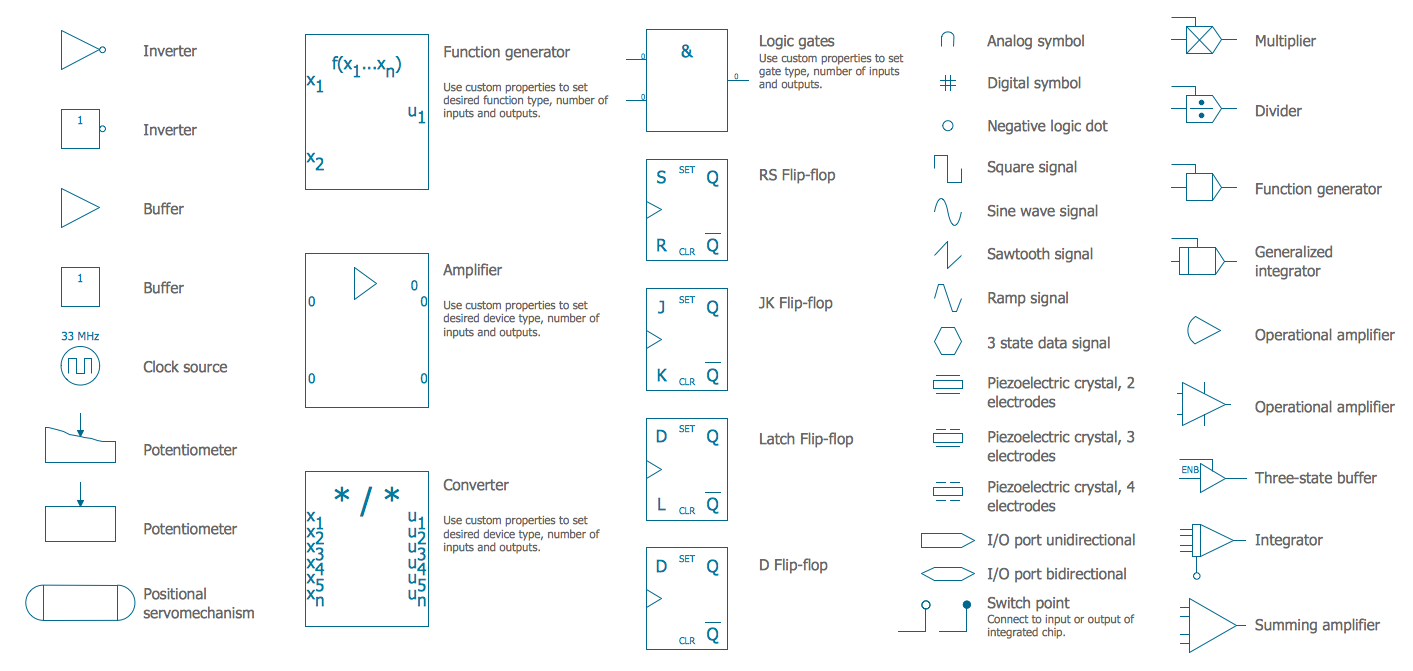
Picture: Electrical Symbols — Analog and Digital Logic
Related Solution:
ConceptDraw
MINDMAP 15