Feature Comparison Chart Software
Feature Comparison Chart is the tool that allows visually compare and analyze the features and functionalities of products and services. The Feature Comparison Charts are very useful and widely used in many fields of activity.
ConceptDraw DIAGRAM is a powerful diagramming and vector drawing software for creating the Feature Comparison Charts quick and easy.
Matrices Solution from the Marketing area of ConceptDraw Solution Park provides templates, samples and ready-to-use vector stencils that will help you draw the professional looking Feature Comparison Charts in a few minutes.

Sample 1. ConceptDraw DIAGRAM - feature comparison chart software.
This sample shows the Feature Comparison Chart of the digital scouting cameras. It can be useful for digital cameras production field, marketing, sales, etc.
Use the Matrices Solution for ConceptDraw DIAGRAM to create your own Feature Comparison Charts independently or using the templates and samples as the base.

Sample 2. Feature comparison chart - Digital scouting cameras.
The Feature Comparison Chart produced with ConceptDraw DIAGRAM are vector graphic documents and are available for reviewing, modifying, and converting to a variety of formats (image, HTML, PDF file, MS PowerPoint Presentation, Adobe Flash or MS Visio).
TEN RELATED HOW TO's:
ConceptDraw DIAGRAM diagramming and vector drawing software extended with Marketing Diagrams Solution from the Marketing Area of ConceptDraw Solution Park is the best software for quick and easy creating Marketing Flow Chart of any complexity and design.
Picture: Marketing Flow Chart
Related Solution:
Credit Card Processing System UML Diagram. This sample shows the Use Case Diagram of the credit card processing system. You can see how the payment by credit card occurs. This sample can be used by the bank, financial enterprises, for understanding the work of the credit card processing system at the projecting the banking systems.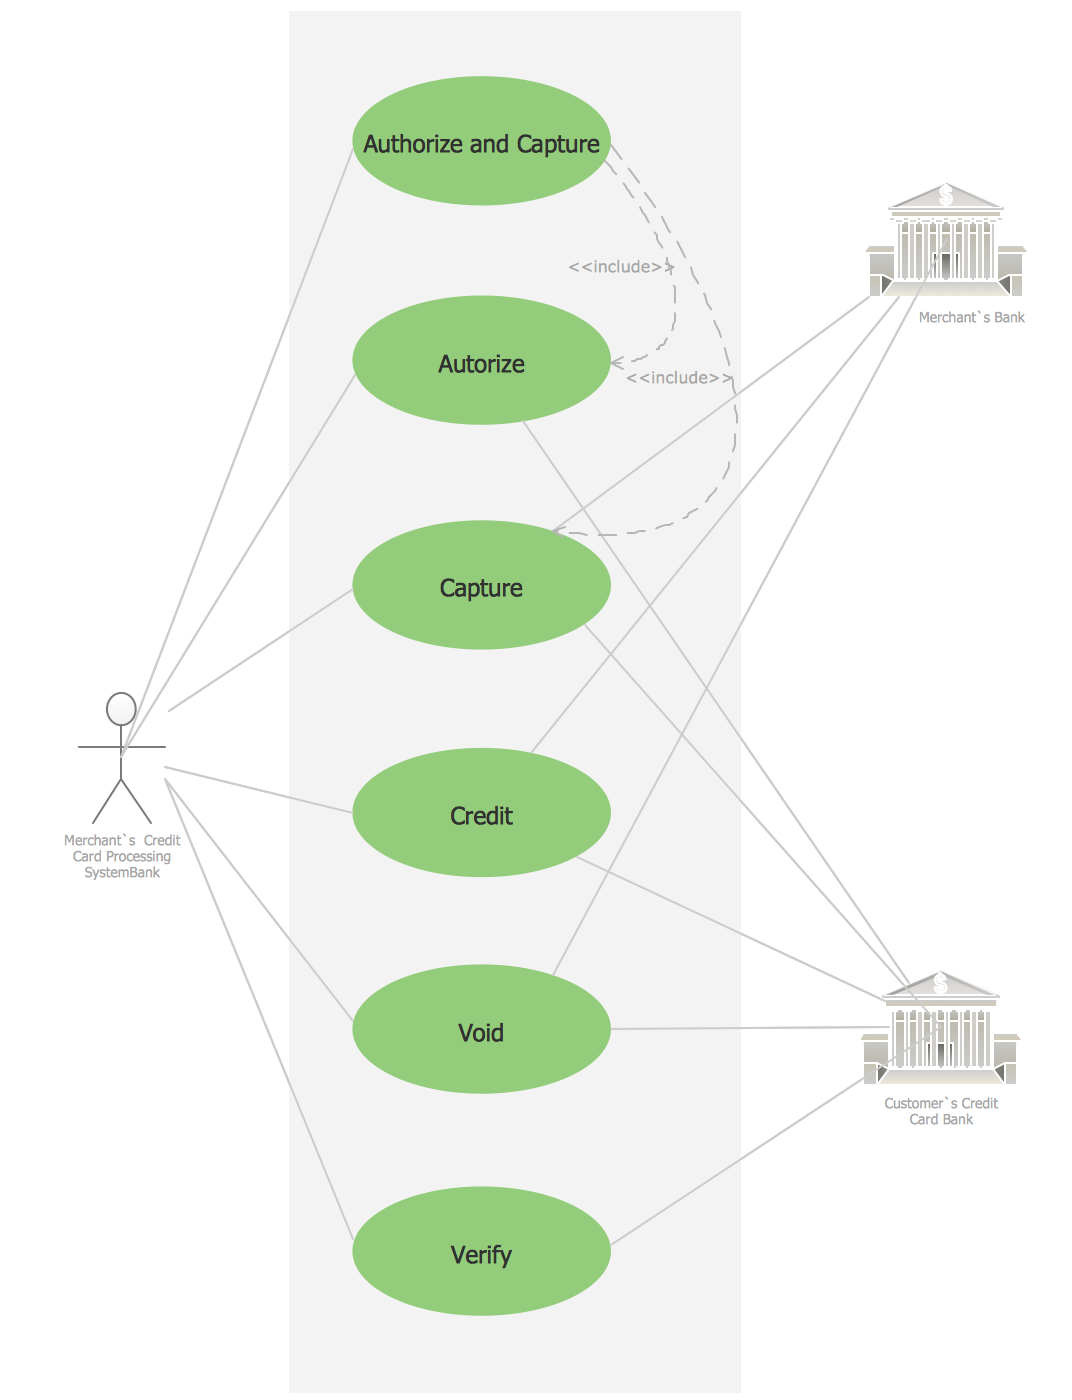
Picture: Credit Card Processing System UML Diagram
Related Solution:
Create bar charts for event management problem solving and visual data comparison using the ConceptDraw DIAGRAM diagramming and vector drawing software extended with the Bar Graphs Solution from the Graphs and Charts area of ConceptDraw Solition Park.
Picture: Bar Diagrams for Problem Solving.Create event management bar charts with Bar Graphs Solution
Related Solution:
Pie Graph is very popular kind of charts which is widely used in various fields of science and life activities. ConceptDraw DIAGRAM extended with Pie Charts Solution from the Graphs and Charts area is the best software for drawing the Pie Graph Worksheets.
Picture: Pie Graph Worksheets
Related Solution:
ConceptDraw DIAGRAM extended with Seven Management and Planning Tools Solution from the Management Area of ConceptDraw Solution Park is the best software for drawing all types of diagrams from the Seven Management and Planning Tools: Affinity Diagram, Relations Diagram, Prioritization Matrix, Root Cause Analysis Tree Diagram, Involvement Matrix, PERT Chart, and Risk Diagram (PDPC).
Picture: PDPC
Related Solution:
Business calendar is a special type of calendar, it must be functional, convenient for scheduling the affairs and meetings, and also must have strict, official and unobtrusive interface. So you must pay special attention to the business calendar design. Now you don't need to be an artist to design business calendar thanks to the unique drawing tools of Calendars Solution for ConceptDraw DIAGRAM diagramming and vector drawing software.
Picture: Business Calendar
Related Solution:
If your company is in chaos in clutter and no one understands their rights and responsibilities, maybe it's time to change that. One of the ways to put the company in order is to draw an organization chart that would reflect the structure and show the relationships among departments and positions. This is a very useful and easy to understand scheme.
This is example of the one of the most typical kind of organizational chart. It depicts an organizational structure of the hierarchical type. Its construction is similarv to pyramid. The single main position on the top - in this case, the mayor's position followed by sub-levels of authority in his command. Each position in the pyramid reports only to his supervisor, and takes only a report of direct subordinates. Such scheme limits the number of communications. This organizational structure is effectively used in public organizations. Also it is suitable for any organization with the need for multiple levels of middle managers. The ability to create organizational charts of different types is supplied with ConceptDraw Ogrcharts solutions.
Picture: How to Draw an Organizational Chart
Related Solution:
The Social Media Response solution creates interactive social media flow charts and action mind maps. The solution includes a video tutorial and a number of samples helping social media teams refine and organize their response process.
Picture: How to Connect Social Media DFD Flowchart with Action Maps
Related Solution:
Creating CCTV system diagrams is quick and easy with ConceptDraw DIAGRAM diagramming software enhanced with Audio, Video, Media solution from ConceptDraw Solution Park. It contains library of vector cliparts of video and TV devices and different digital gadgets for drawing this kind of diagrams.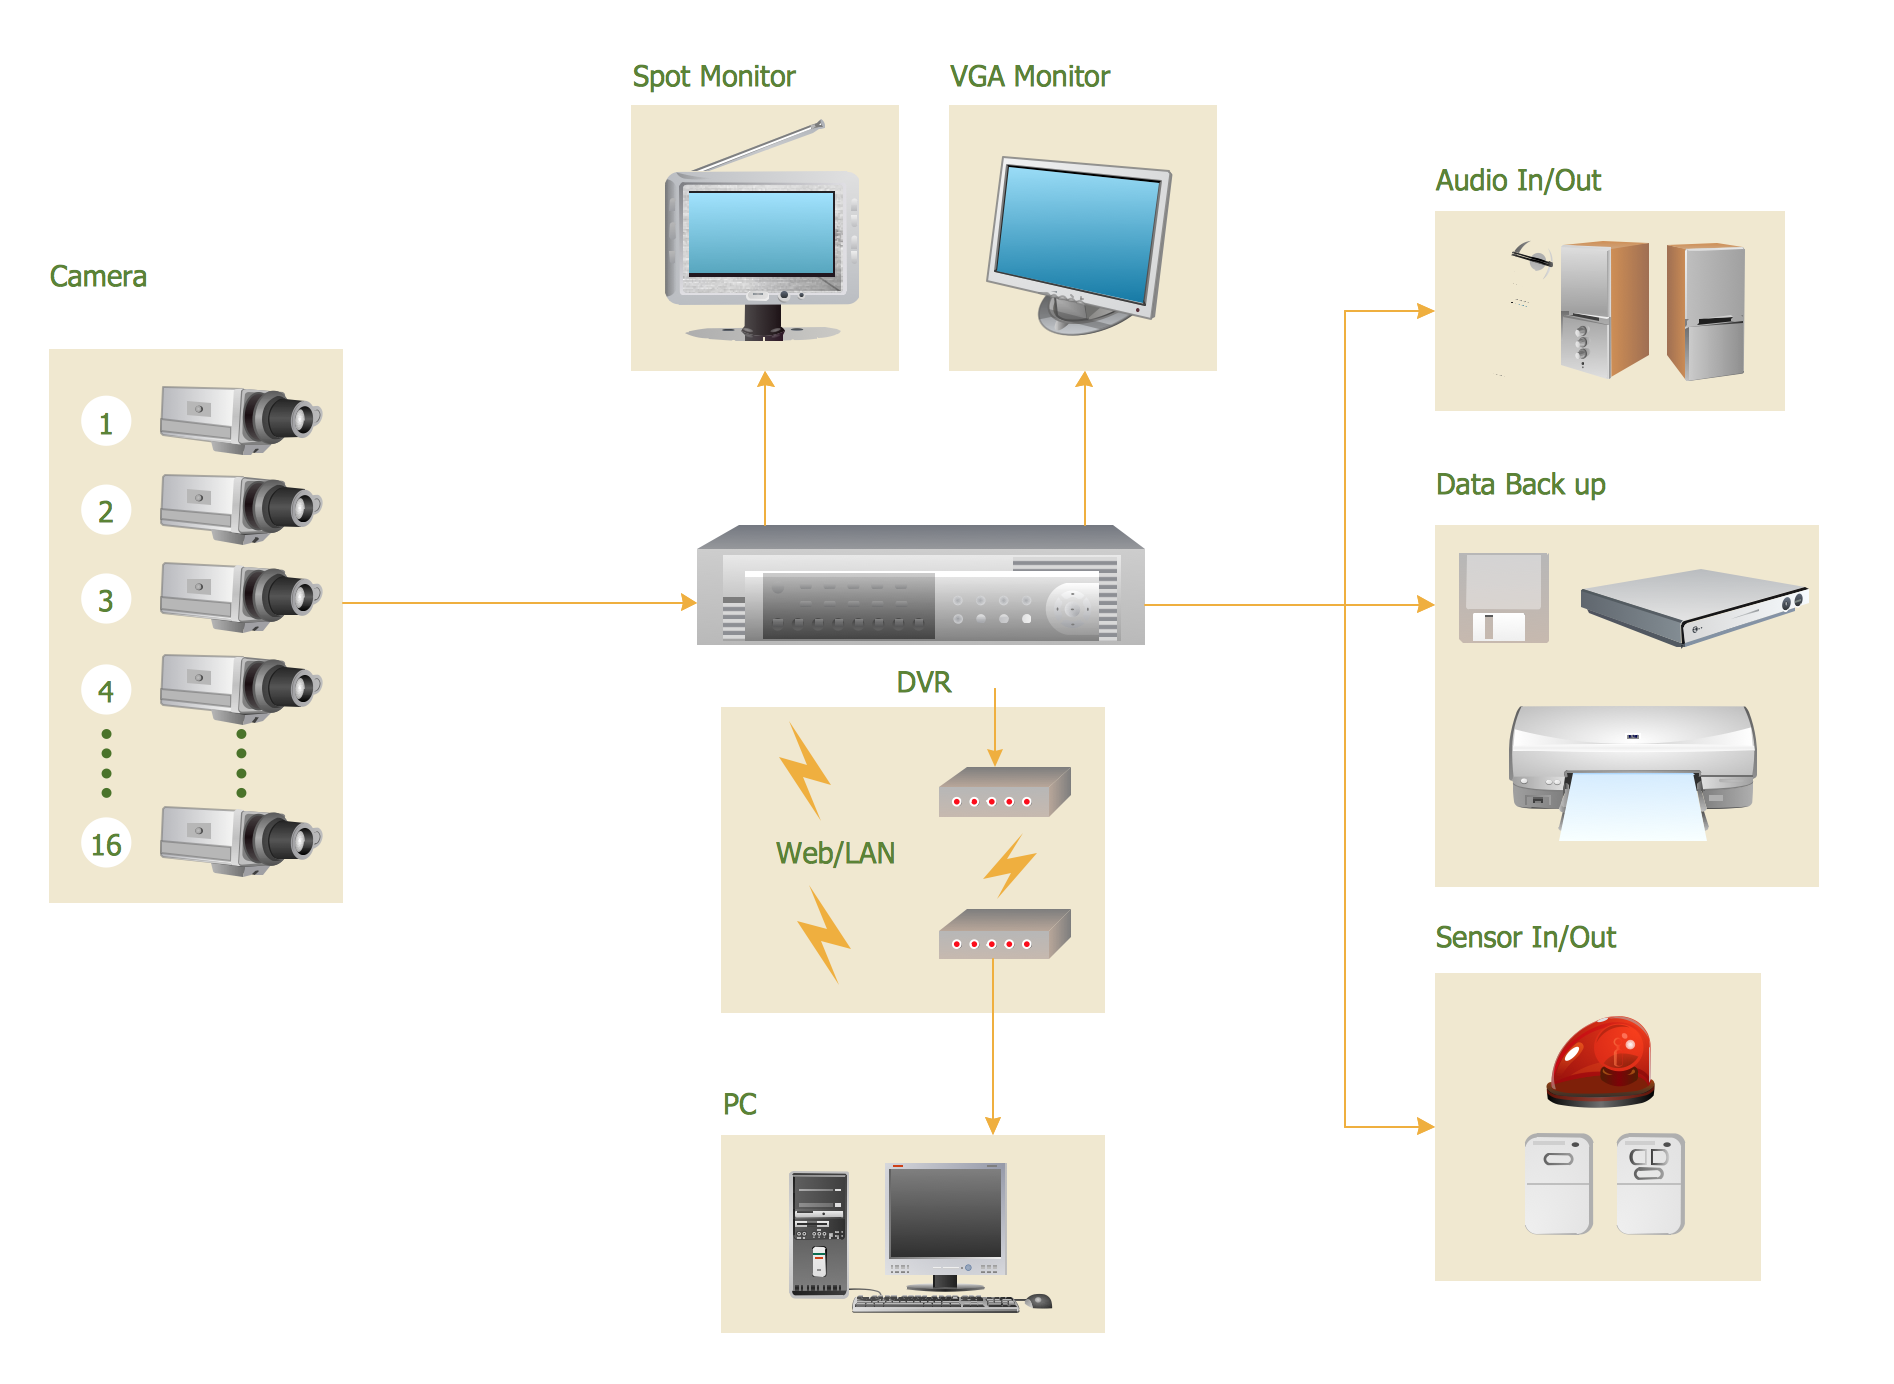
Picture: CCTV Surveillance System Diagram. CCTV Network Diagram Example
Related Solutions: