Entity Relationship Diagram Examples
Crow’s Foot and Chen's notation examples
Creating the entity-relationship (ER) model by visually representing the structure of some database, mainly the business one, which data equates to its entities (or objects) that are connected by relationships showing requirements and dependencies, you need proper software to provide you with the symbols necessary in this case.
ConceptDraw DIAGRAM мector drawing and diagramming software allows you to make any of needed models, plans, charts, diagrams with help of our application STORE where lots of layouts can be found as well as samples and templates of the flowcharts depending on the business sphere you work in and requirements you have. You can also find examples of ERD in Solutions here on this site in order to make it look really smart. Making entity-relationship diagram based on the Chen ERD notation is simple now having ConceptDraw DIAGRAM and you can check it yourself once you download and use it. Advice your colleagues and your friends, business partners, in order to simplify their lives as well as yours making the charts looking professional and simply sophisticated. Because we guarantee the quality of our great software developed to please everyone who needs this product in their work.

Example 1. ERD Example — Chen Diagram
This sample diagram is one of ER Diagram examples included to Entity-Relationship Diagram (ERD) solution. It shows the type of icons and graphics you can use to develop a model of a database of arbitrary complexity according to Chen's notation.

Example 2. ERD Example — Crows's Foot diagram
This sample diagram was created using the drawing tools of Entity-Relationship Diagram (ERD) solution and shows the type of icons and graphics you can use to develop a model of a database of arbitrary complexity using Crow's Foot notation.

Example 3. Entity Relationship Model Diagram — Crows's Foot notation
This sample demonstrates an Entity-relationship model diagram. Highlight the boxes in the ERD diagram with bright colors to make it attractive and easy to remember.

Example 4. Crows's Foot ERD notation — Students and Teachers
This Entity-Relationship Diagram shows the relationships between the Students and Teachers entities. Drawing all entities of ER-diagram in one color spectrum, highlighting the headers, you will make your diagram look stylish and then successfully use it in different conferences, discussions, publications.

Example 5. Chen ERD notation — WordPress File reference
This ERD example shows an Entity-Relationship Diagram of a WordPress file reference using Chen’s Notation, which represents the entities as rectangles and attributes as ovals. Creating similar Entity Relationship Diagram examples and diagrams in ConceptDraw DIAGRAM will take just minutes.

Example 6. Chen ERD Template
This template from Entity Relationship Diagram (ERD) solution contains special objects and settings for creating entity relationship diagrams based on the Chen ERD notation.
How to Create an ERD Diagram
The ability to describe a database using the Entity-Relationship model is delivered by the Entity-Relationship Diagram (ERD) solution.
Open ConceptDraw STORE, check the ERD solution and click “Install”.
This solution extends ConceptDraw DIAGRAM with 2 libraries that contains 45 objects advocated by Chen's and Crow’s Foot notations that can be used when describing a database.

Pic. 1. ERD symbols - Chen's notation

Pic. 2. ERD symbols - Crow's Foot notation
- From the ConceptDraw STORE open the Chen's ERD, or the Crow's Foot ERD template from the ERD section.
- Add objects to the diagram by dragging them from the Chen's ERD, or the Crow's Fot ERD library to the document page.
- Use Clone tool
 (Mac),
 (Win) to quickly add copies of the selected object.
- Select the Smart Connector tool
 . To connect elements using this tool, drag the connector from one connect dot to another.
- Use Line, Fill, Shadow and Text tools to format diagram objects.

Example 6. Entity Relationship Diagram Examples
The ERD solution from ConceptDraw Solution Park extends ConceptDraw DIAGRAM ector graphics and diagramming software with the ability to describe a database using the Entity-Relationship model.
The ERD solution provides entity relationship diagram examples, templates and library of vector stencils.

Example 7. Entity Relationship Diagram solution
Entity Relationship Diagram examples from ERD solution for ConceptDraw DIAGRAM can be used as a start point for professional ERD drawing. Entity Relationship Diagram examples can be simply modified to illustrate the logical structure of exact database.
TEN RELATED HOW TO's:
The ConceptDraw Flowchart component includes a set of samples and templates. This geathered as flowchart maker toolbox which focused on drawing flowcharts of any industry standards.
Picture: Flowchart Components
Related Solution:
Entity Relationship Diagram (ERD) is an acknowledged method to visualize the logical structure of databases. Using special symbols described in ERD notations you can depict a database of any complexity.
The vector graphic ER diagrams produced when using ConceptDraw ERD solution can be used in whitepapers, presentations, datasheets, posters, or any technical materials.
Picture: What is Entity-Relationship Diagram
Related Solution:
Creating of Entity-Relationship Diagrams (ERDs) is a complex process that requires convenient, automated tools. ConceptDraw DIAGRAM diagramming and vector drawing software offers a powerful ER Diagram Tool - the Entity-Relationship Diagram (ERD) Solution from the Software Development Area.
Picture: ER Diagram Tool
Related Solution:
A list of parameters on which networks differ is very long. A large network with a range up to 50 kilometers is called metropolitan area network (MAN), and this type of network can include several local area networks. Metropolitan networks in their turn connect into global area networks.
Here you will see a Metropolitan Area Network (MAN). This is an extensive network which occupies a large territory including a few buildings or even the whole city. The space of the MAN is bigger than LAN, but lower than WAN. MAN comprise a lot of communication equipment and delivers the Internet connection to the LANs in the city area. Computer and Networks solution for ConceptDraw DIAGRAM provides a set of libraries with ready-to-use vector objects to design various kinds of computer networks.
Picture: Metropolitan area networks (MAN). Computer and Network Examples
Related Solution:
The ConceptDraw vector stencils library Cisco Multimedia, Voice, Phone contains equipment symbols for drawing the computer network diagrams.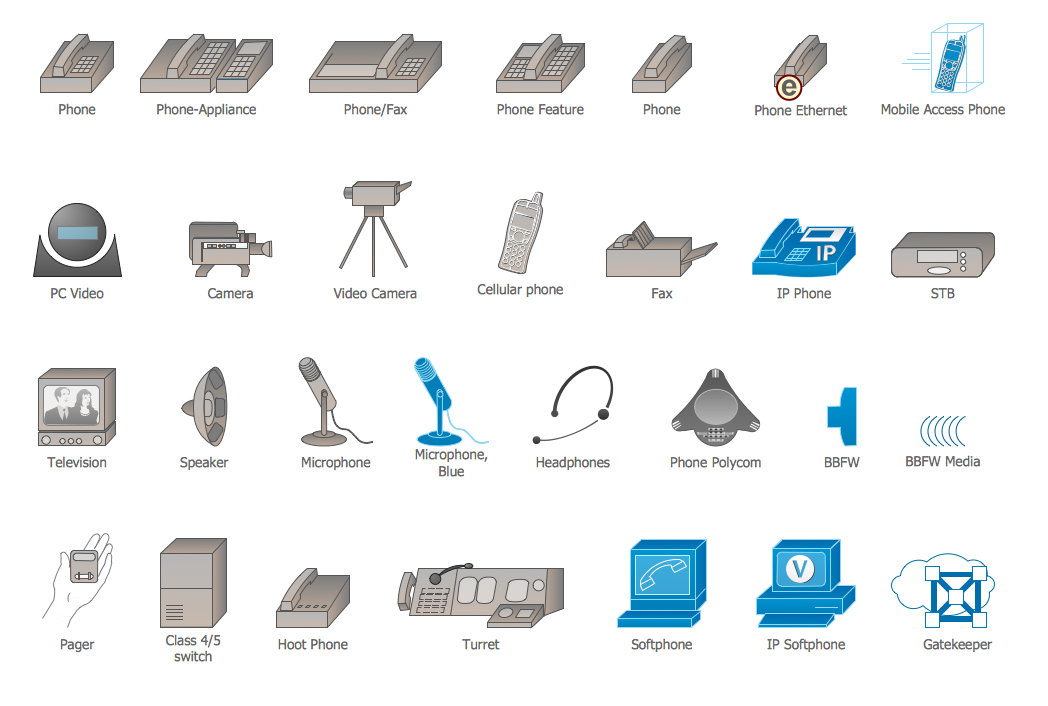
Picture: Cisco Multimedia, Voice, Phone. Cisco icons, shapes, stencils and symbols
Related Solution:
A network diagram represents the set of computers and network devices and the connections among them. This scheme can be developed for any institution or establishment. To illustrate this concept let’s take for example, a hotel network topology diagram or a school network diagram. These diagrams depict access points, servers, workstations, firewalls and another equipment needed to provide a network.
On this masterpiece drawing one will see a simple scheme a of connecting computers together. Such form of connecting can be applied for a hotel, guest house, bungalow, hut or something else. This diagram shows the images of the real LAN components. So, it represents a physical category of a network construction. It looks similar to a star - so this network configuration is named a star topology. The typical feature of this construction is a center point - usually it is hub, or router. The rays of this star means network connections. Computers, peripherals and other network details are placed on the ends of the star rays.
Picture: Hotel Network Topology Diagram
Related Solution:
Local area network connects computers and other network appliances within an area, such as office building or a campus. It can be difficult to provide such network without a predesigned plan. For these purposes you can use network diagram software, which helps you to create LAN network diagrams and office network diagrams quickly and effortless. This will speed up your work and you can save the diagram for the future network improvements.
The following diagram illustrates a network topology of the small office. LAN configuration has a star topology. The local network joins 8 computers among which are several desktop PCs, laptop, two iMacs and iBook. The end-point devices are divided into three groups. Each group is connected to its hub. There is a network printer and a modem, which are interconnected with other devices through a network server. Each computer on the LAN can access the server through a corresponding hub.
Picture: Network Diagram Software. LAN Network Diagrams. Physical Office Network Diagrams
Related Solution:
ConceptDraw DIAGRAM is a powerful chemistry drawing software that provides the useful tools to help you design all kinds of chemistry drawings and illustrations, chemical schemes and diagrams of formulas, reaction schemes and lab set-ups of any complexity.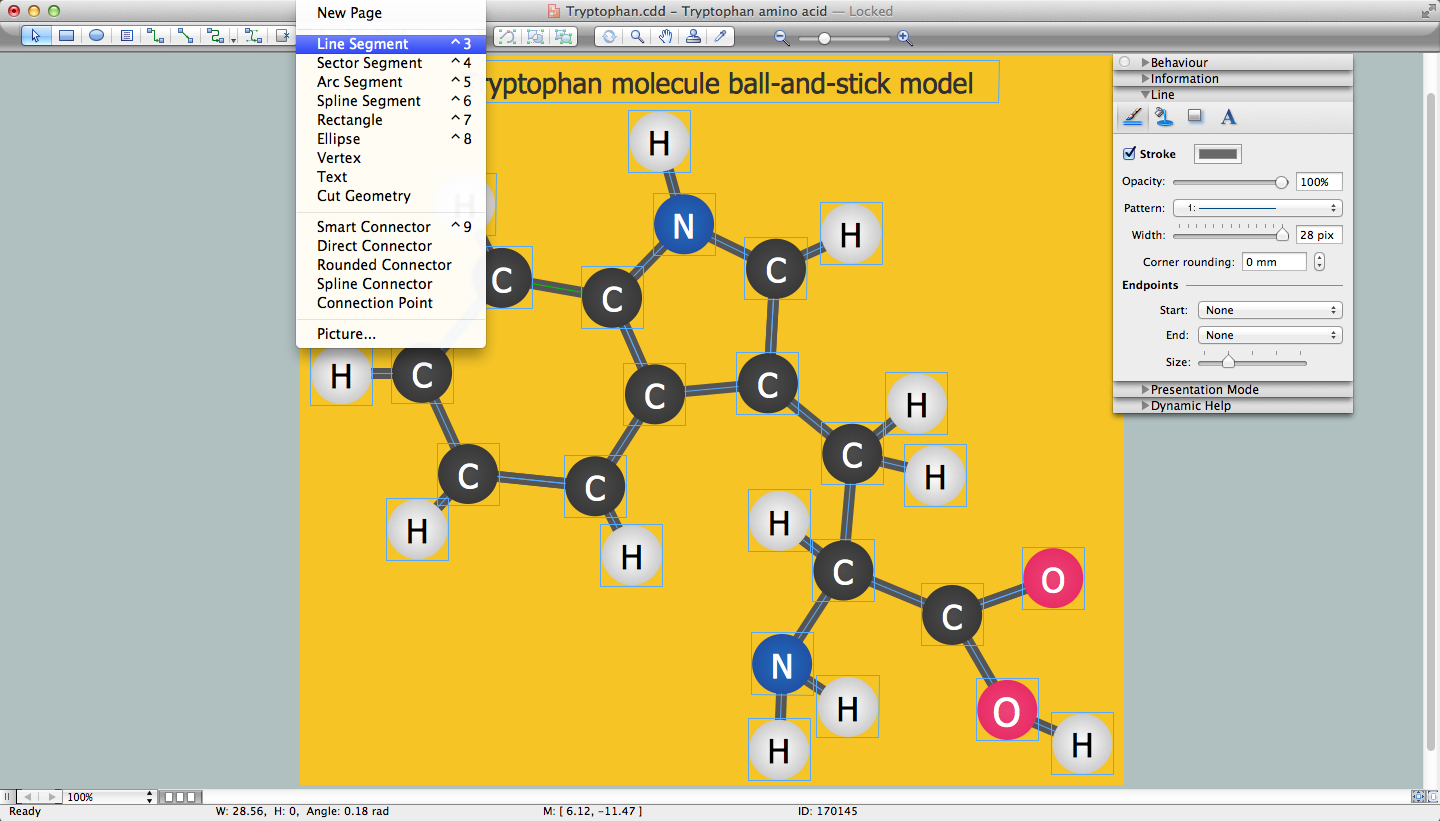
Picture: Chemistry Drawing Software
Related Solution:
Data base diagrams describes inter-related data and tables. It describes roles and relationships, internal and external dependencies, data exchange conventions and structures of knowledge domain.
ConceptDraw Software provides number of data-base chart libraries including major 49 vector symbols. Use these DFD flowchart symbol libraries to design data-base structure and models, use it to design data base process-oriented models, or simple data-oriented models. The are special drawing tools for making data flowcharts, data process diagrams, structured analysis diagrams, and information flow diagrams.
Picture: Database Flowchart Symbols
Related Solution:
Data structure diagram (DSD) is intended for description of conceptual models of data (concepts and connections between them) in the graphic format for more obviousness. Data structure diagram includes entities description, connections between them and obligatory conditions and requirements which connect them. Create Data structure diagram with ConceptDraw DIAGRAM.
Picture: Data structure diagram with ConceptDraw DIAGRAM


