
Sample 1. Block diagram - Types of individual behavior in organization.
ConceptDraw DIAGRAM diagramming software provides vector shapes and connector tools for quick and easy drawing diagrams for business, technology, science and education.
Use ConceptDraw DIAGRAM enhanced with solutions from ConceptDraw Solution Park to create diagrams to present and explain structures, process flows, logical relationships, networks, and other visually organized information and knowledge.
TEN RELATED HOW TO's:
Imagine the diagram which is looking smart. That is how ConceptDraw Arrows10 Technology or Smart connectors work.
Thanks to auto-routing feature connectors flow around objects. But if you want some background objects that the connectors flow through - that is also possible to do.
Picture: ConceptDraw Arrows10 Technology
The Basketball Field library from the Basketball solution provides a complete set of ready-to-use predesigned vector courts: horizontally and vertically located, whole and half of court, colored and not, courts with views from different sides.
All courts objects are designed according to the real basketball courts dimensions. Simply drop the needed basketball field in the vector from the library to design your own basketball diagram.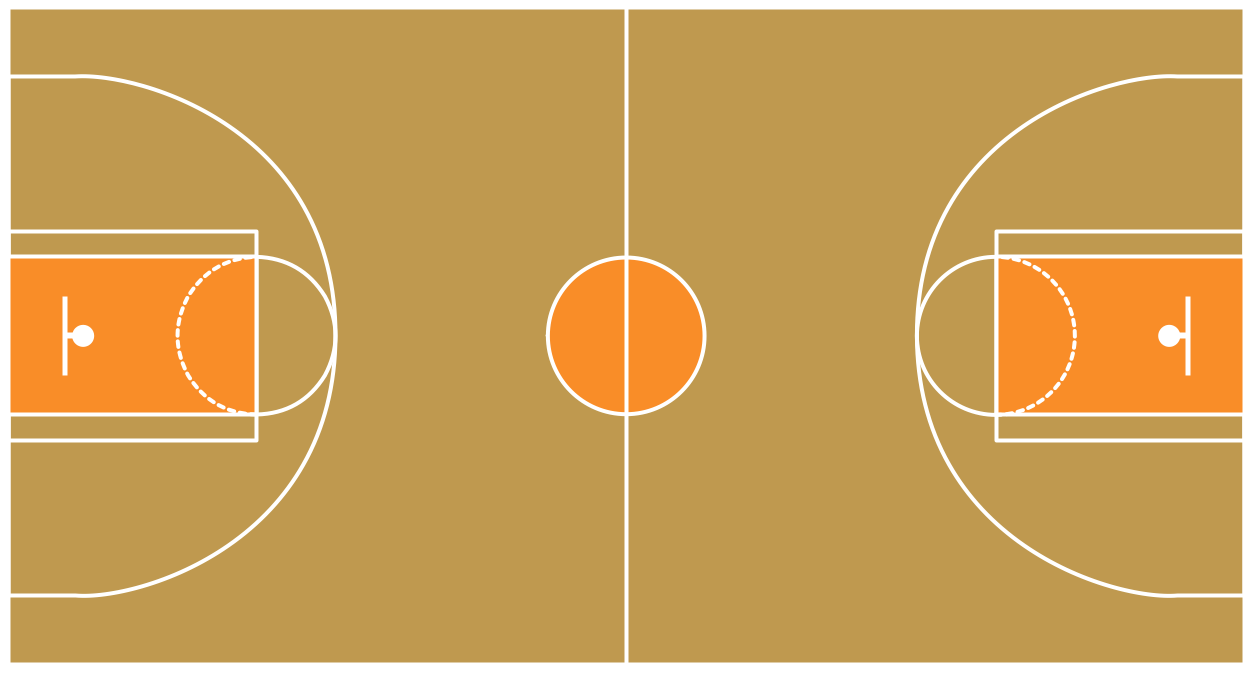
Picture: Basketball Field in the Vector
Related Solution:
Visual information is easier to perceive. You can teach even a child to make diagrams with a good flowchart example that would be interesting for it. Flowcharts can be fun, it’s not about business processes or programming algorithms.
This flowchart shows step by step process of manufacturing of Nixtamal The product which is obtained by processing maize with calcium hydroxide. We must assume that the Aztecs were very fond of this product, if the recipe of its production came to our times. This flow chart was designed using ConceptDraw DIAGRAM with its solution for designing flowcharts of various types, sizes and purposes. ConceptDraw Flowcharts solution consists from the library of flowchart symbols, containing the set vector objects. Also there are a lot of diverse templates and samples of flow charts.
Picture: Flowchart Examples and Templates
Related Solution:
The Line Graphs solution from Graphs and Charts area of ConceptDraw Solution Park contains a set of examples, templates and design elements library of line and scatter charts. Use it to draw line and scatter graphs using ConceptDraw DIAGRAM diagramming and vector drawing software for illustrating your documents, presentations and websites.
Picture: Line Chart Examples
Related Solution:
ConceptDraw DIAGRAM diagramming and vector drawing software provides the unique Flowcharts Solution from the Diagrams Area of ConceptDraw Solution Park with variety of vector objects libraries and collection of examples Flowchart. Each example flowchart included in Flowcharts solution is a real help in drawing process, it can be the good base or perfect source of inspiration.

Picture: Examples Flowchart
Related Solution:
ConceptDraw Arrows10 Technology - This is more than enough versatility to draw any type of diagram with any degree of complexity.
Picture: ConceptDraw Arrows10 Technology
The vector stencils library from the solution Information Model Diagrams contains specific data type symbols of the EXPRESS-G notation such as entity data type symbols, simple data type symbols, enumeration data type symbols, defined data type symbols, select data type symbols and specific attribute symbols for ConceptDraw DIAGRAM diagramming and vector drawing software. The Information Model Diagrams solution is contained in the Software Development area of ConceptDraw Solution Park.
Picture: Express-G Diagram
When thinking about the process of decision making, it's easy to imagine it as a pyramid. We will look at a three level pyramid model as an example. Operational decisions are first that come to mind, and it's the first level. Tactical and strategic decisions are the second and the third levels.
Pyramid (triangle) diagrams are used to show some hierarchical data. Because to the pyramid form of diagram, each diagram slice has a different width. The width of each segment depends on its hierarchical level.
The current image illustrates the model of information system types. Most graphically the model can be represented as a three level pyramid. The first level shows a system of transaction processing It is concentrated on operational tasks. The second level is devoted to tactical solutions of the information system management. And at least, the third level addresses strategy and represents the executive information system. This three level pyramid sample is supplied with the ConceptDraw Pyramid Diagrams solution from Marketing area of ConceptDraw Solution Park.
Picture: Pyramid Diagram
Related Solutions:
The best Entity Relationship Diagram tool for Mac - ConceptDraw DIAGRAM, extebded with the professional ERD drawing solution. The vector graphic diagrams can be drawn by everybody.
Picture: Diagramming Tool Mac
The diagrams with highest level in the hierarchy define the main processes or subsystems with external and internal data sources. To detail them, DFD Library is used to build a system of lower level diagrams. This decomposition continues hereinafter it is meaningless.
This data flow diagram of a system of a library management is a context-level DFD. The data flow diagram of this type depicts the large system as a solid process, and does not input any explanation of its content. It is an ordinary practice - creation of a context-level data flow diagram when starting system development. This DFD was made using ConceptDraw solution designed especially for data flow diagrams development. One can find out Data Flow Diagrams Solution in a Solution Park of ConceptDraw and can use in as addition to the common Conceptdraw DIAGRAM diagramming tools.
Picture: DFD Library System
Related Solution: