ConceptDraw DIAGRAM : Able to Leap Tall Buildings in a Single Bound
ConceptDraw DIAGRAM is the world’s premier cross-platform business-diagramming tool. Many, who are looking for an alternative to Visio, are pleasantly surprised with how well they can integrate ConceptDraw DIAGRAM into their existing processes. With tens of thousands of template objects, and an easy method for importing vital custom objects from existing Visio documents, ConceptDraw DIAGRAM is a powerful tool for making extremely detailed diagrams, quickly and easily. What comes to a surprise to some, however, is that underneath all of the functionality of ConceptDraw DIAGRAM lies a robust visual scripting language. The support for scripting in Visio permits users to automate processes, customize objects, and support external data structures.
That’s right. ConceptDraw DIAGRAM includes the ConceptDraw Basic development environment, right out of the box. What’s more, you can use Visual Basic scripts from other geometric drawing environments to define the behaviors of documents, pages, and objects. The scripting language is a standard Basic language, usable at several levels of the program, breathing new life into Visual Basic scripts that may have been sitting on the shelf for years.
The development tools in ConceptDraw DIAGRAM aren’t just for those proficient in coding. The Power Edit Function allows you to add and remove hundreds of object-functions from within the attribute tables. By using attribute tables, you can define click-through states, make new objects, or even create rapid-draw functions, allowing for flexible editing of your custom objects. With ConceptDraw DIAGRAM attribute tables, even intermediate and novice users will be able to do complex drawing operations quickly and efficiently.
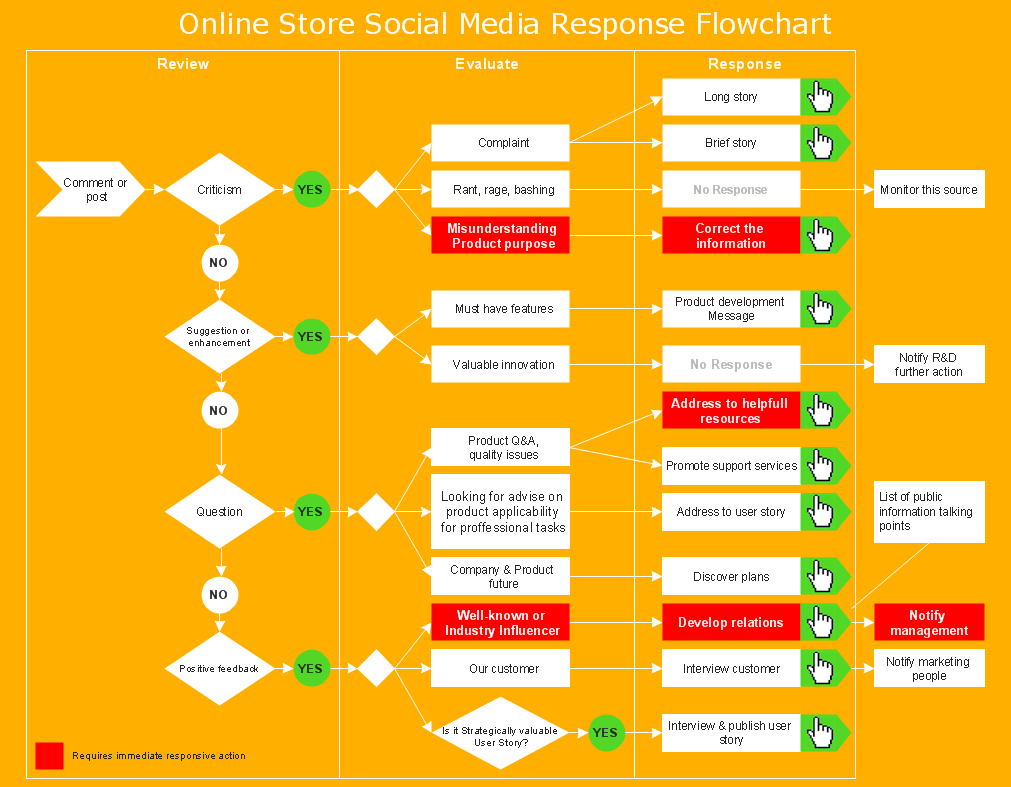
Pic. 1. Marketing flow chart - Online store social media response flowchart
Easy to Use Powerful Drawing Tool for OS X and Windows
ConceptDraw DIAGRAM is an advanced and powerful standalone business graphics and diagramming software tool that supports Macintosh (OS X) and PC (Windows) desktops, giving users choice of platform without sacrifice to functionality. ConceptDraw DIAGRAM contains hundreds of templates to produce AWS Architecture, BPMN, Flowcharts, Dashboards, Software Development, etc. ConceptDraw DIAGRAM is used by organizations around the world to document and describe the conditions that impact their business. With all of the drawing sophistication built into ConceptDraw DIAGRAM one would think there is a steep learning curve. Sophisticateed drawing has never been so easy to learn and master. Novices can draw like in pros in just minutes.
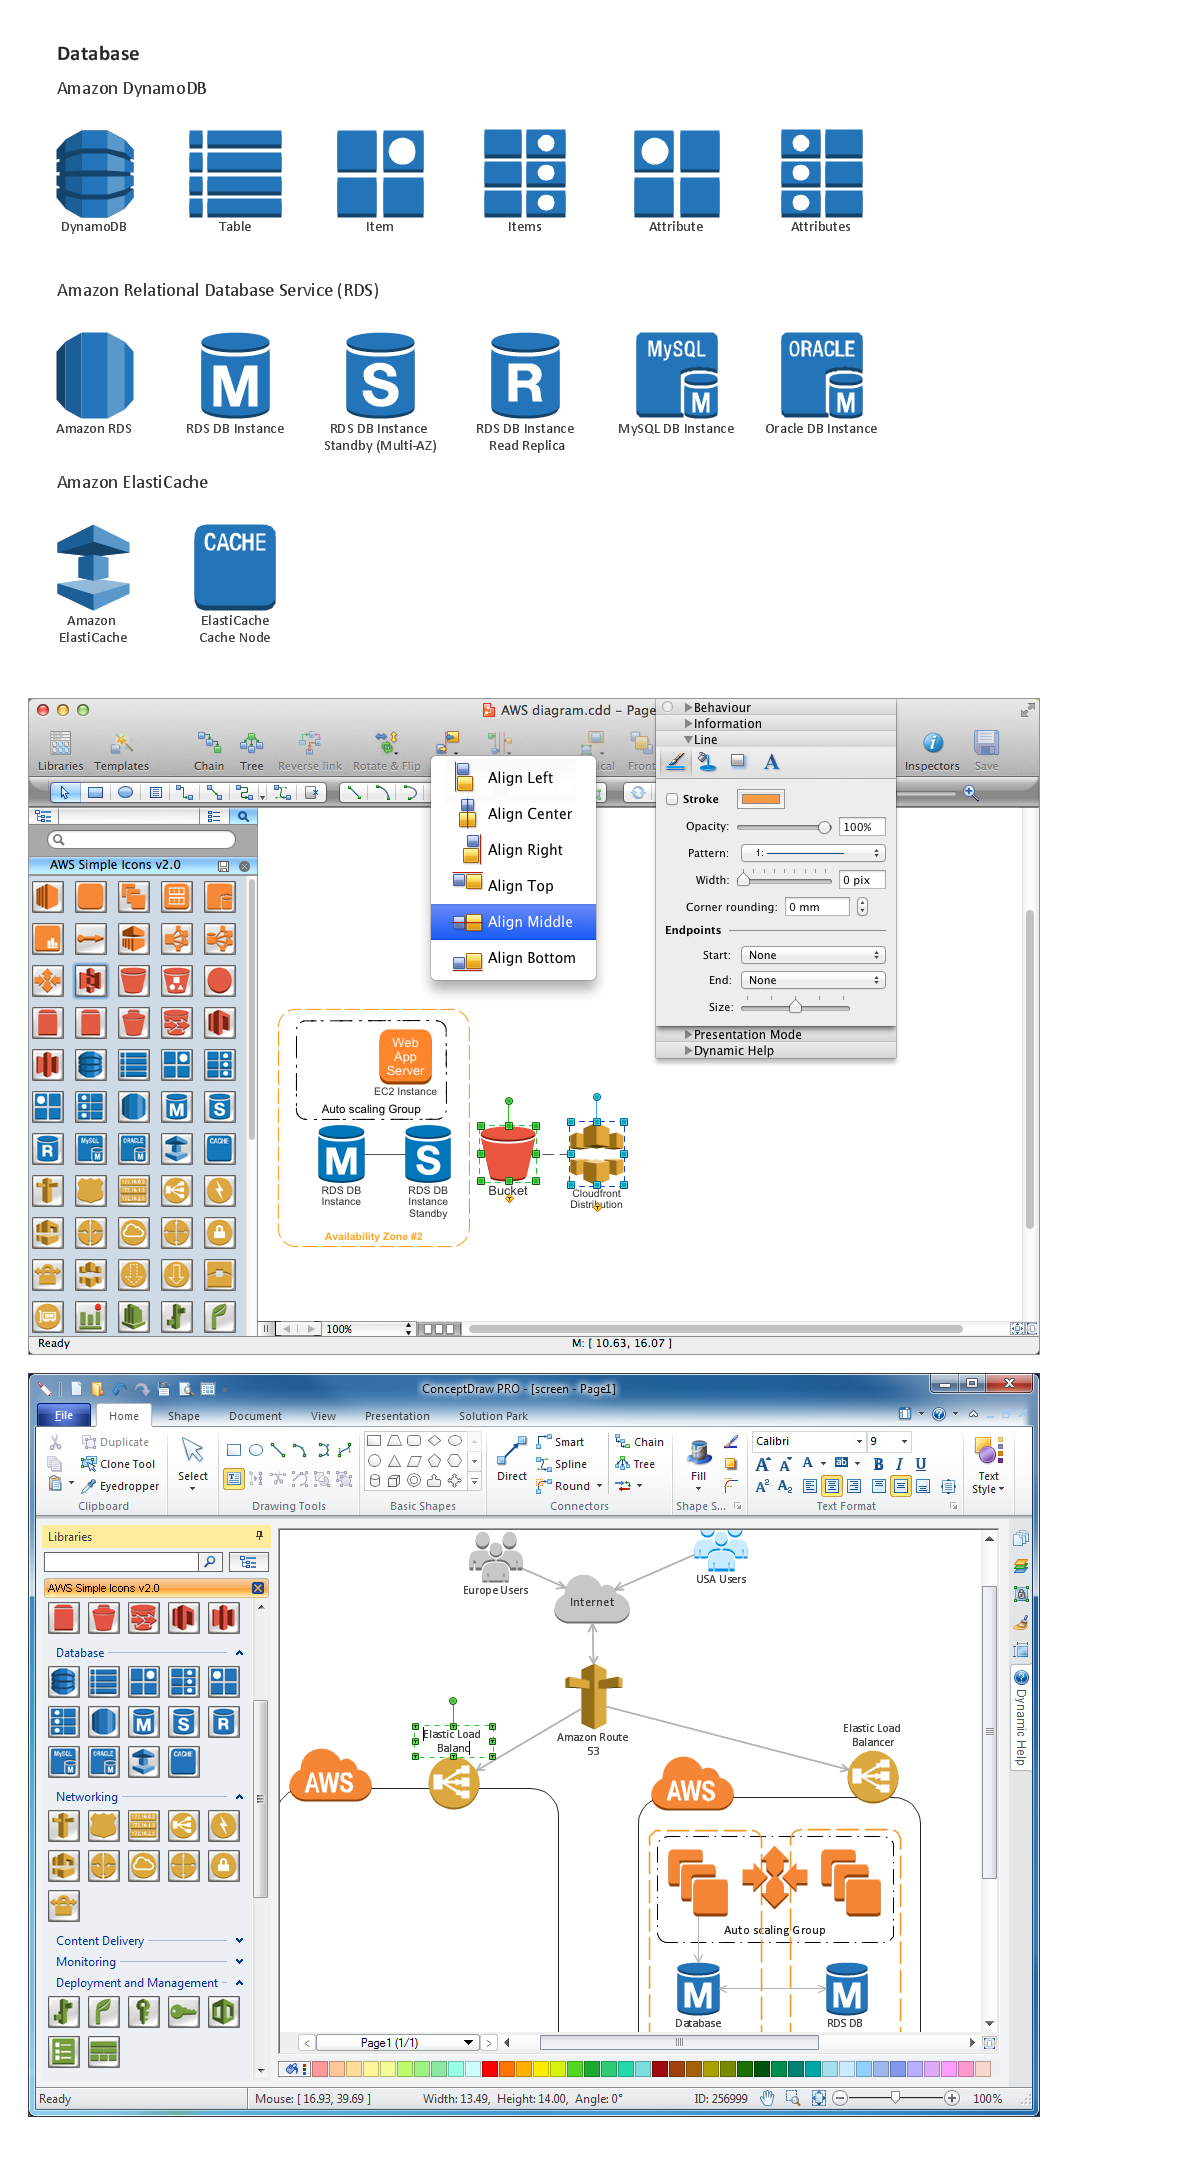
Pic. 2. Amazon Web Service icon set: Data Base
What Makes ConceptDraw DIAGRAM a Leader
ConceptDraw DIAGRAM with its sophisticated drawing power, high usability quotient, extensive number of templates and drawing objects, Mac and PC support, no-charge technical support, extensive learning resources, and economical price; coupled with extensive support of scripting, makes for a tremendous value. Pairing the drawing prowess of ConceptDraw DIAGRAM with its sophisticated ability to use Visual Basic scripts opens a new visual world to corporations, individuals, and programmers, going beyond simple drawing and diagramming requirements and into the world of professionals.

Pic. 3. Start using: Business and Finance Solution
NINE RELATED HOW TO's:
Mac compatible remote presentation, A simple way to share your presentation remotely via Skype. All participants receive presentation file.
Picture: Mac Compatible Remote Presentation
Related Solution:
While studying, many of the students encounter the necessity of remaking class projects, over and over. To facilitate this process you can use special electrical and telecom plan software, which helps altering projects in several clicks. Using templates will fasten your work, and you will have more free time.
This sample represents an electrical and telecommunication floor plan. Electrical and telecom floor plans contain a floor plan , on which imposed the layout of electrical, and telecommunications equipment. They shows electrical and telecom details regarding the current floor of a building: lightening, fixtures, wires, outlets, circuit panels, etc. Using of standart notation of electrical and telecommunication symbols makes the plan understandable for engineers, architects, constructors, specialist in electricity and telecommunications.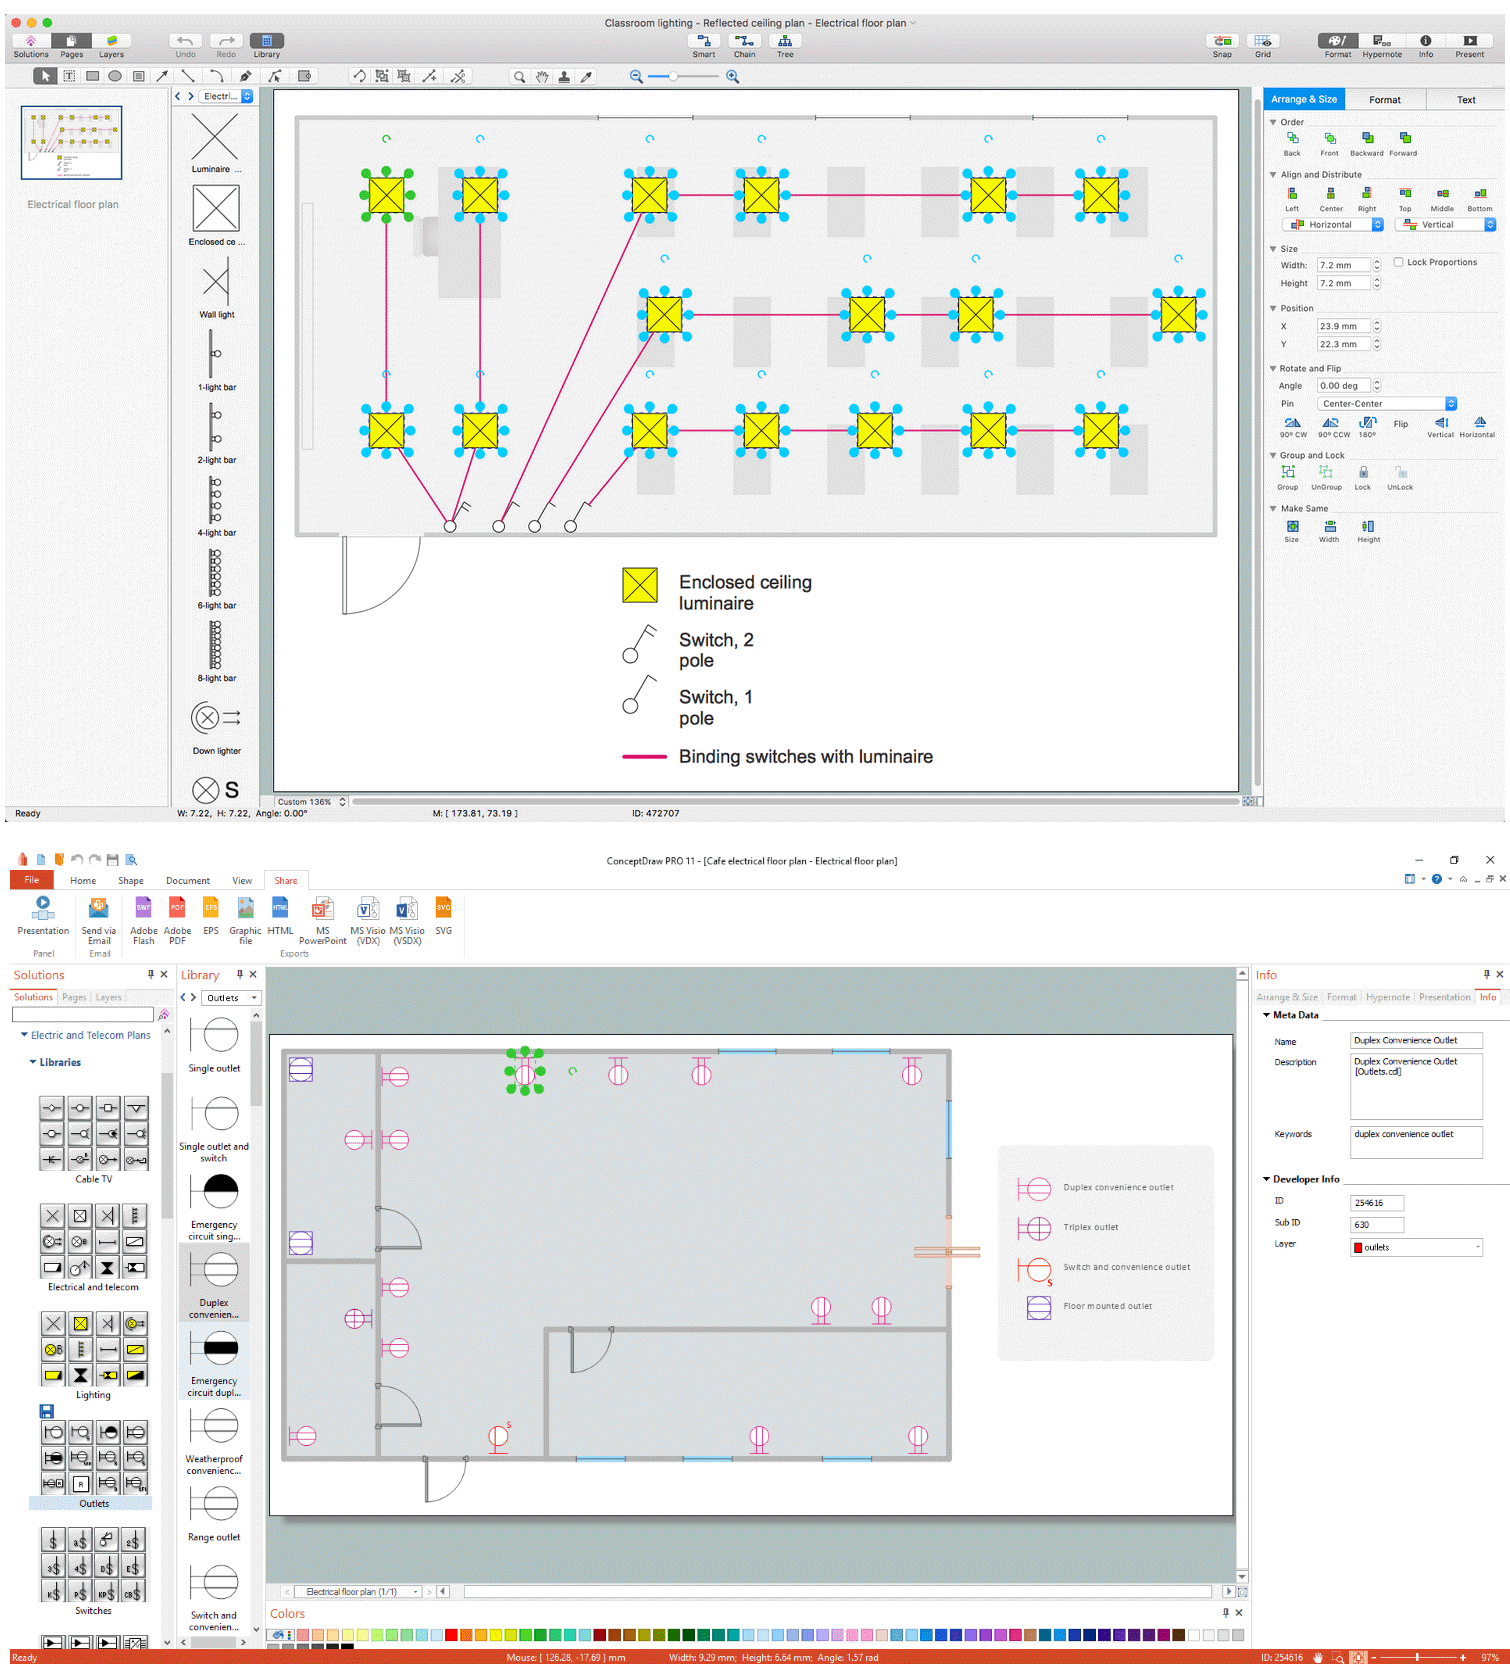
Picture: Electrical and Telecom Plan Software
Related Solution:
Use ConceptDraw DIAGRAM diagramming and business graphics software to draw your own flowcharts of computer algorithms.
Picture: Process Flow app for macOS
Related Solution:
If you have no time, you can create a SWOT diagram even on asphalt using a chalk. Although, in case you want a proper scheme, you should use a special software for creating SWOT analysis diagrams that would be comprehensible. SWOT analysis is useful not only for business purposes, but even for cities or for a particular person.
The ConceptDraw SWOT and TOWS Matrix Diagrams solution is a tool for performing both SWOT and TOWS analysis. It provides templates of different sorts of Matrix Diagrams. Besides different embedded templates, the solution enabling create custom SWOT and TOWS matrices. Using the compatibility between the MINDMAP and DIAGRAM is the best way of making SWOT or TOWS diagrams quickly. The mind map templates help identify the core statements of SWOT and TOWS analysis: Strengths, Weaknesses, Opportunities, and Threats. The next step is matrix creation - both SWOT and TOWS analysis use the same basic steps and the only difference is the order in which these criteria are studied.
Picture: Software for Creating SWOT Analysis Diagrams
Related Solution:
ConceptDraw DIAGRAM is a powerful tool for business and technical diagramming.
Software Development area of ConceptDraw Solution Park provides 5 solutions:
Data Flow Diagrams, Entity-Relationship Diagram (ERD), Graphic User Interface, IDEFO Diagrams, Rapid UML.
Picture: Software Diagram Examples and Templates
Related Solution:
No need for any special drawing skills to create professional looking diagrams outside of your knowledge base. ConceptDraw DIAGRAM takes care of the technical details, allowing you to focus on your job, not the drawing.
Picture: Crea Diagramas De Flujo
An event-driven process chain diagram is a flowchart used in business process analysis. It evolved from Architecture of Integrated Information Systems (ARIS) and utilised in the business process improvement and analysis. It is also used to facilitate enterprise resource planning.
An EPC diagram is a complex flowchart that shows different business processes through various workflows. The workflows are seen as functions and events that are connected by different teams or people, as well as tasks that allow business processes to be executed.
ConceptDraw DIAGRAM is a software for making EPC diagrams that allows managers visually present business process models for making decisions for business.
Picture: How to Draw EPC Diagram Quickly
Related Solution:
The most easier way of creating the visually engaging and informative Sales Process Flowchart is to create the new ConceptDraw document and to use the predesigned vector symbols offered in 6 libraries of the Sales Flowchart Solution. There are more than six types of sales process flow diagrams, ConceptDraw DIAGRAM software is flowchart maker which include six collections of extended flowchart symbols for effective diagramming. There are main collections of color coded flowchart symbols: Sales Department, Sales Steps, Sales Workflow, Sales Symbols and special set of Sales Arrows and Sales Flowchart.
Picture: Sales Process Flowchart Symbols
Related Solution:
The Involvement Matrix can identify the distribution of responsibilities and identify roles in a group or team. Use the Involvement Matrix to specify roles and responsibilities of actions in problem solving.
ConceptDraw Office suite is a software for corrective actions planning.
Picture: CORRECTIVE ACTIONS PLANNING. Involvement Matrix