Android GUI
Android is an operating system based on the Linux kernel and developed by Google for smartphones, tablet computers, electronic books, netbooks, smartbooks, digital players, watches, game consoles, TV and other devices.
ConceptDraw DIAGRAM extended with Android User Interface Solution from the Software Development Area is a powerful software with extensive drawing tools which can help you to build the intelligible, attractive and easy for perception Android GUI for your application.

Example 1. Android GUI - Android 5.0 App Drawer
The components which compose the graphic user interface are specific for each operating system, and Android is not exception. Android has many own features that make it diverse from iOS and other mobile platforms. Android User Interface Solution provides 30 libraries with 1088 Android GUI vector objects.
These 30 libraries contains all objects needed for drawing unique Android GUI - app icons, wallpapers, menu items, buttons, switches, sliders, text fields, dialogs, and more other Android GUI design elements.

Example 3. Android GUI - Android 5.0 Lock Screen Notifications
The Android GUI samples you see on this page were created in ConceptDraw DIAGRAM using the tools of Android User Interface Solution. These samples demonstrate solution's capabilities and the professional results you can achieve. An experienced user spent 10 minutes creating each of them.
Use Android User Interface solution for designing your own Android GUI quick, easy and effective.
All source documents are vector graphic documents. They are available for reviewing, modifying, or converting to a variety of formats (PDF file, MS PowerPoint, MS Visio, and many other graphic formats) from the ConceptDraw STORE. The Android User Interface Solution is available for all ConceptDraw DIAGRAM or later users.
TEN RELATED HOW TO's:
ConceptDraw - feature-rich flowchart software allows you create professional looking flowcharts.
Picture: Best Program to Create a Flowchart
Related Solution:
Interior design is an art of planning and coordinating the space in a building or on a floor to produce a charming and convenient environment for the client. You can ask professionals for help, or you can create floor plans easily with ConceptDraw DIAGRAM , using diverse libraries or altering numerous templates. You don’t need no formal training anymore to be a designer, isn’t it great?
Using a ConceptDraw DIAGRAM floor plan software makes depicting of home or office layout ideas a simple task. It does not require special skills to make detailed and scaled floor plans. Adding furniture to design interior is also a breeze. You can draw and furnish your floor plans with a floor plan software. Moreover, using software for floor planning you gain an opportunity to share your plans and high-resolution images of your designs with clients or stakeholders.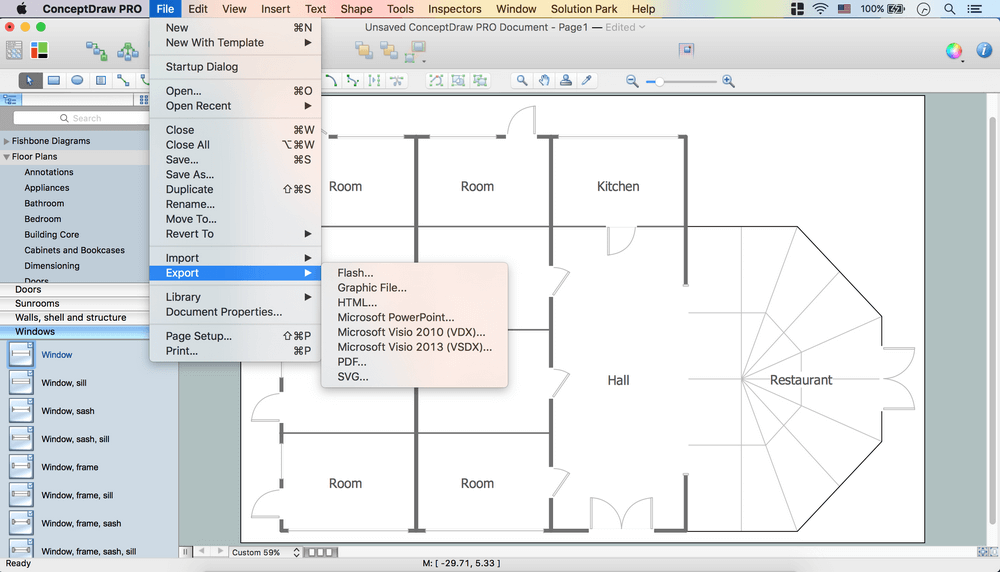
Picture:
Create Floor Plans Easily
with ConceptDraw DIAGRAM Floor Design Software
Related Solution:
Functional modeling allows to make complex business processes simple. One of the basic methods is IDEF0 and one of the most effective also. To create a business model, use flowchart symbols.
The IDEF0 library, supplied with ConceptDraw IDEF0 Diagrams solution contains 18 IDEF0 basic notation symbols. All symbols are the vector graphic images what means, that one can customize their size preserving the stable quality. Another library of IDEF0 symbols can be find out in the the Business Process Diagrams solution, included to the Business Processes section of ConceptDraw Solution Park. These libraries composed from just vector objects and are totally compatible. You can apply the IDEF0 symbols from both libraries at your flowcharts, if needed.
Picture: IDEF0 Flowchart Symbols
Related Solution:
Times when you had difficulties in searching for an appropriate software depending on your OS, had passed. If you still look for a great software to create flowcharts on Mac, here is the answer. ConceptDraw Pro is a great tool for creating diagrams, with tons of samples, libraries and tutorials.
Making flowchart diagram is the best way to represent a process as a sequence of steps. Flowcharting provides a simple way of organizing and representing data so that even complex and detailed processes become clear. That is why using a flowchart software tool is proven to be an ideal for structure and share an information on process workflow structure. This flow chart was created to depict the steps of certification process. This flow chart was created using ConceptDraw DIAGRAM software for Apple OS X. The Rapid Draw technology was used to create this flow chart. ConceptDraw DIAGRAM also supports popular Apple OS X features such as Quick Look, Full-Screen Mode, Version Browsing and Autosave. You can export your multi-page diagrams to SVG or graphic formats such as TIFF, JPEG, PNG and PDF.
Picture: Create Flow Chart on Mac: The Comprehensive Guide
Related Solution:
ConceptDraw DIAGRAM application is perfect for creating workflow diagrams. This application contains specific features and technologies designed to draw diagrams faster, such as RapidDraw and Arrows10. ConceptDraw DIAGRAM software extended with the Workflow Diagrams solution gives you a flexible tool to draw any kind of workflow.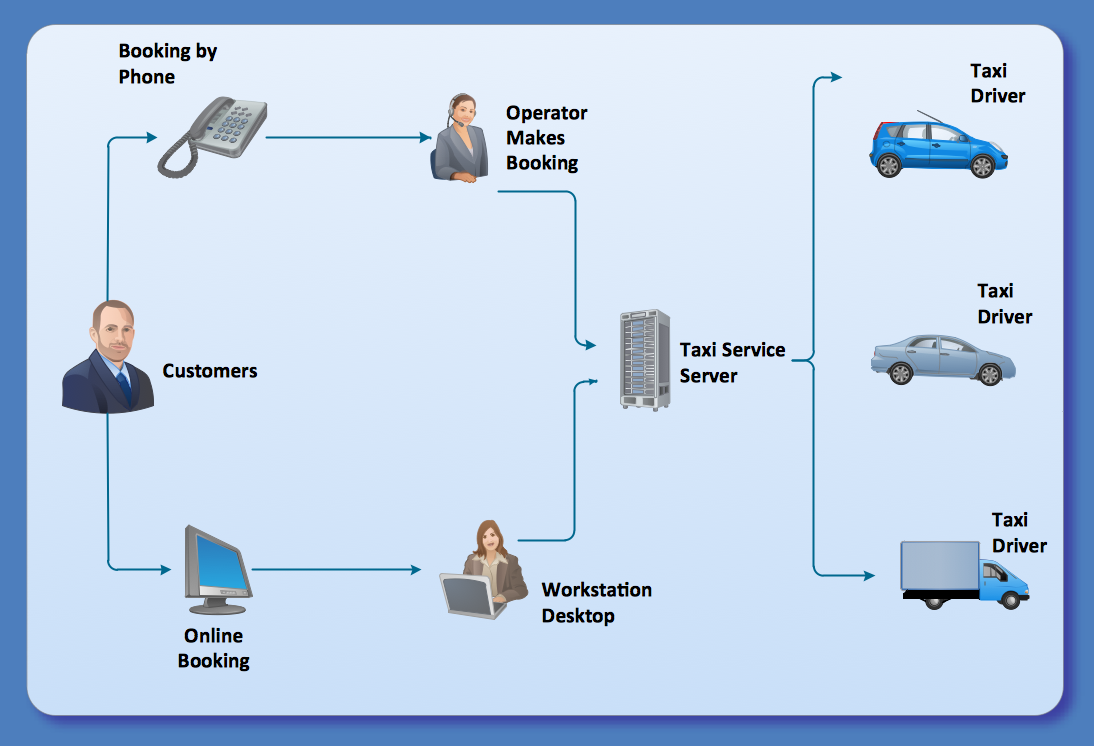
Picture: Workflow Application
Related Solution:
There are a lot of structured analysis and design technique methodologies used to describe systems and data sources. To visualize data structures, data flow diagrams can be used for various purposes in the area of software engineering. Nowadays these diagrams are also used in the area of business analysis and information system analysis.
This data flow diagram depicts an account processing system of a typical account department of a small manufacturing enterprise. It shows the data transmission through the order processing to shipping verification. This data flow diagram was created according to standard of Yourdon and Coad notation. The vector graphic objects of Yourdon/Coad notation symbols was delivered by ConceptDraw Data Flow Diagrams solution. The current DFD can be employed as an example of a business process model, representing the set of business events and interactions commonly engaged in a accounts receivable process.
Picture: Data Flow Diagrams
Related Solution:
How to draw Telecommunications Network Diagram quick, easy and effective? ConceptDraw DIAGRAM offers the unique Telecommunication Network Diagrams Solution from the Computer and Networks Area which will help you.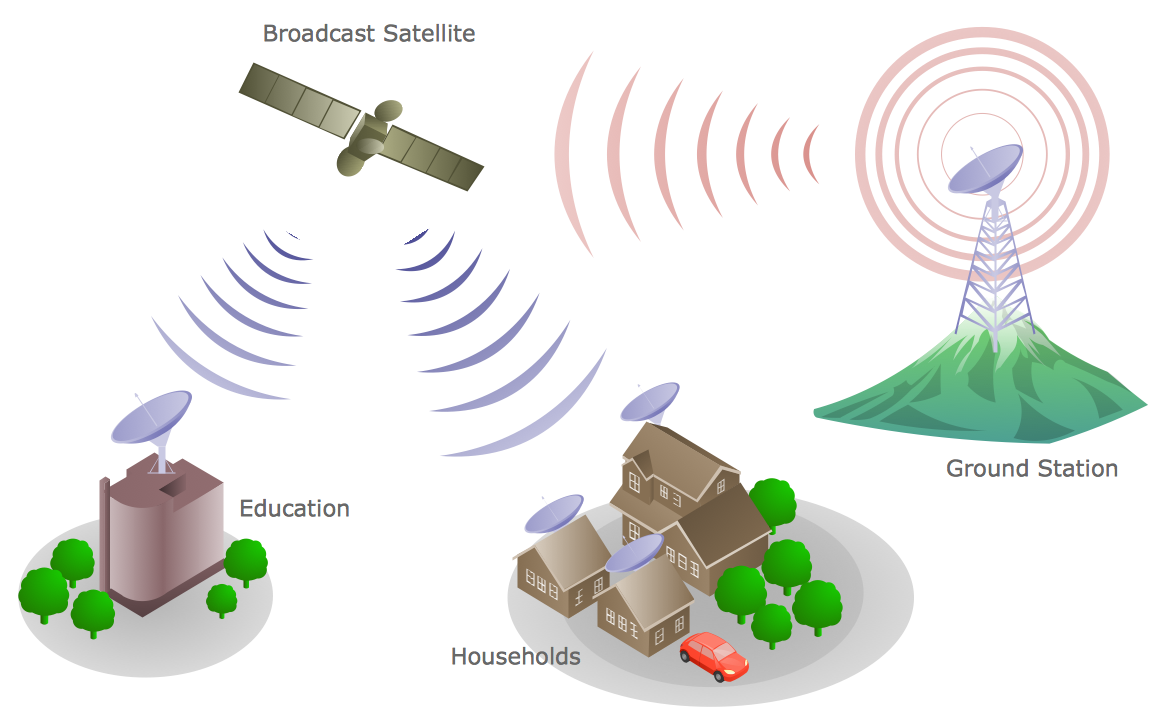
Picture: Telecommunications Network
Related Solution:
ER-modeling nowadays is a very popular approach for database design. If you are tired of looking for a good entity relationship diagram Software for Mac, then your search is almost over. ConceptDraw DIAGRAM is a great tool for creating diagrams of any complexity with tons of editable samples and templates.
This diagram represents the vector library of the Chen’s and Crow’s Foot notation icons for drawing ERD (entity-relationships diagram). ConceptDraw Entity Relationship Diagram solution delivers the ability to visualize databases structure on both Mac and PC. The "bricks" entity-relationships models are the entity, and the relation. An entity is represented by a rectangle comprising the entity name. It means an object, information about which should be available and stored. A relation is intended to show a relations between two entities. There are several types of relations between entities. To show there are a number of different symbols for the types of relationships.
Picture: Entity Relationship Diagram Software for Mac
Related Solution:
What is a computer network? This is a set of devices and systems that are connected to each other (logically or physically) and communicate with each other. This could include servers, computers, phones, routers, and so on. The size of this network can reach the size of the Internet, and can consist of only two devices connected by a cable.
This sample shows the connection scheme of the home WLAN equipment to the Internet.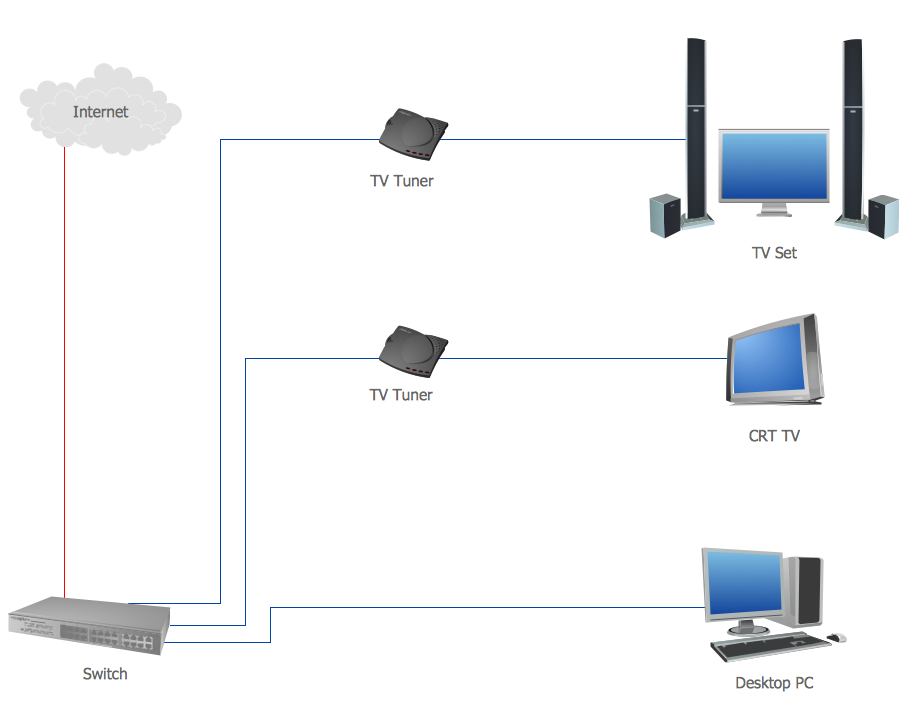
Picture: Diagram of a Basic Computer Network. Computer Network Diagram Example
Related Solution:
Data visualization is an important part of any software design. To understand how diagrams can improve your work, you can use examples of flowcharts that can be easily found on Internet. Flowcharts represent processes as sequences of steps written in appropriate symbols.
Launching a website is a complex process. There’s a lot to accomplish, and multiple people who need to participate. This flowchart can be helpful in planning and prioritizing tasks, making the process well-organized and clear for both developers and customers. This example flowcharts was build using ConceptDraw Flowcharts solution. It is really handy and helpful for starting any website project. It includes the set of milestones, and activities that can be easily customized and applied to any individual project.
Picture: Flowchart Design: Contoh Flowchart
Related Solution:


