HelpDesk
How to Draw a Pictorial Chart in ConceptDraw PRO

Sample Pictorial Chart. Sample Infographics
")
How to Draw Pictorial Chart. How to Use Infograms

Pictorial Chart

Design Pictorial Infographics. Design Infographics

Basic Diagramming


Infographic Maker

The vector stencils library "Picture Graphs" contains 35 templates of picture bar graphs for visual data comparison and time series.
Drag a template from the library to your document, set bars number, type category labels, select bars and enter your data.
Use these shapes to draw your pictorial bar charts in the ConceptDraw PRO diagramming and vector drawing software.
The vector stencils library "Picture Graphs" is included in the Picture Graphs solution from the Graphs and Charts area of ConceptDraw Solution Park.
Arrow
Water drop

Food

Grain

Agriculture

Medicines

Houses

Buildings

Money bags

Oil barrels

Natural gas

Electrical power

Nuclear power

Mechanical engineering

Chemical industry

Mining

Gold bars

Coins

Person

Men, women and children

Man

Woman

Child

Milk

Meat

Fruits

Vegetables

Computer

Mobile phone

Airliner

Car

Bus

Truck

Train

Cargo ship

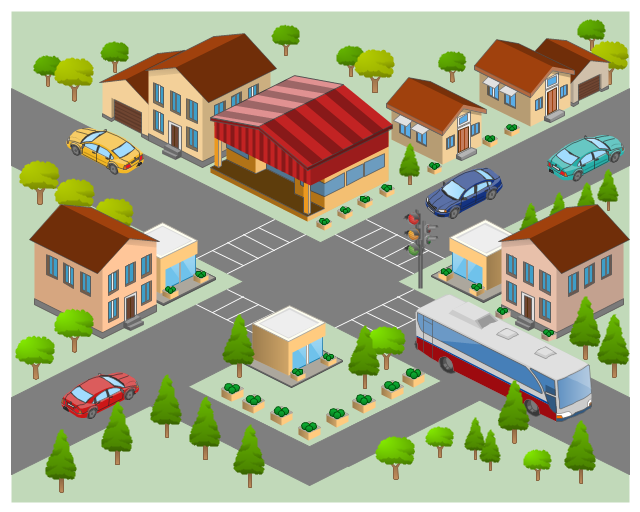
The 3D pictorial street maps are used as road maps, route maps, locator maps, transit maps, directional maps, tourist maps with points of interest (POI).
"A point of interest, or POI, is a specific point location that someone may find useful or interesting. ...
Most consumers use the term when referring to hotels, campsites, fuel stations or any other categories used in modern (automotive) navigation systems. ...
The term is widely used in cartography, especially in electronic variants including GIS, and GPS navigation software. In this context the synonym waypoint is common.
A GPS point of interest specifies, at minimum, the latitude and longitude of the POI, assuming a certain map datum. A name or description for the POI is usually included, and other information such as altitude or a telephone number may also be attached. GPS applications typically use icons to represent different categories of POI on a map graphically." [Point of interest. Wikipedia]
The example "3D pictorial street map" was created using the ConceptDraw PRO diagramming and vector drawing software extended with the Directional Maps solution from the Maps area of ConceptDraw Solution Park.
3D pictorial street map
The vector stencils library "Picture bar graphs" contains 35 templates of pictorial charts. Use it for visualization of data comparison and time series with ConceptDraw PRO diagramming and vector drawing software.
"Pictorial bar graph.
Sometimes reffered to as a pictographs. A pictorial bar graph is a graph in which the rectangular bars have been filled with pictures, sketches, icons, etc. or where pictures, sketches, icons, etc. have been substituted for the rectangular bars. In both variations, one or more symbols might be used in each bar. The two major reasons for using pictorial graphs are to make the graph more appealing visually and to facilitate better communications." [Information Graphics: A Comprehensive Illustrated Reference. R. L. Harris. 1999. p.41]
The pictorial charts example "Design elements - Picture bar graphs" is included in the Picture Graphs solution from the Graphs and Charts area of ConceptDraw Solution Park.
Templates

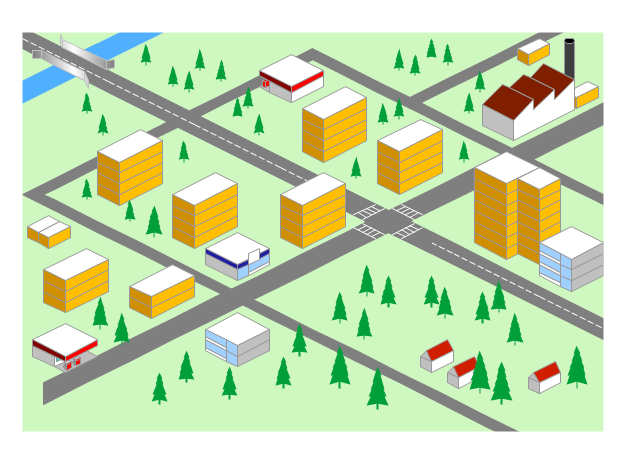
"Road maps come in many shapes, sizes and scales. Small, single-page maps may be used to give an overview of a region's major routes and features. ...
Highway maps generally give an overview of major routes within a medium to large region ranging from a few dozen to a few thousand miles or kilometers.
Street maps usually cover an area of a few miles or kilometers (at most) within a single city or extended metropolitan area. City maps are generally a specialized form of street map." [Road map. Wikipedia]
This 3D pictorial road map example was created using the ConceptDraw PRO diagramming and vector drawing software extended with the Directional Maps solution from the Maps area of ConceptDraw Solution Park.
3D Directional map
Best Program to Make Workflow Diagrams

Tools to Create Your Own Infographics

Map Software

- How to Draw a Pictorial Chart in ConceptDraw PRO | How to Draw ...
- How to Draw a Pictorial Chart in ConceptDraw PRO | Sample ...
- How to Draw a Pictorial Chart in ConceptDraw PRO | Design ...
- How to Draw Pictorial Chart . How to Use Infograms | Sample ...
- Sample Pictorial Chart . Sample Infographics | Pictorial Chart | Line ...
- Design Pictorial Infographics. Design Infographics | Sample Pictorial ...
- Pie Graph Worksheets | Sample Pictorial Chart . Sample Infographics ...
- Sample Pictorial Chart . Sample Infographics | How to Draw Pictorial ...
- Pictorial Chart | How to Draw Pictorial Chart . How to Use Infograms ...
- Sample Pictorial Chart . Sample Infographics | How to Draw a ...
- How to Draw a Pictorial Chart in ConceptDraw PRO | Process ...
- How to Draw Pictorial Chart . How to Use Infograms | Basic Flowchart ...
- Blank Scatter Plot | How to Draw a Pictorial Chart in ConceptDraw ...
- Sample Pictorial Chart . Sample Infographics | Design Pictorial ...
- Basic Diagramming | Sample Pictorial Chart . Sample Infographics ...
- Pictorial Chart | Infographic Maker | Sample Pictorial Chart . Sample ...
- Pictorial Chart | Sport pictograms. Olympic Games | HR Flowchart ...
- How to Draw Pictorial Chart . How to Use Infograms | Sport ...
- World Population Infographics | Sample Pictorial Chart . Sample ...
- Bar Graphs | Sales Growth. Bar Graphs Example | Line Graphs ...