Organizational Structure Total Quality Management

Competitor Analysis

ERD Symbols and Meanings


Flowchart Marketing Process. Flowchart Examples

Horizontal Flowchart

 Scatter Diagrams
The Scatter Diagrams solution extends ConceptDraw DIAGRAM functionality with templates, samples, and a library of vector stencils that make construction of a Scatter Plot easy. The Scatter Chart Solution makes it easy to design attractive Scatter Diagrams used in various fields of science, work, and life activities. ConceptDraw DIAGRAM lets you enter the data to the table and construct the Scatter Plot Graph automatically according to these data.
Local area network (LAN). Computer and Network Examples
 diagram")

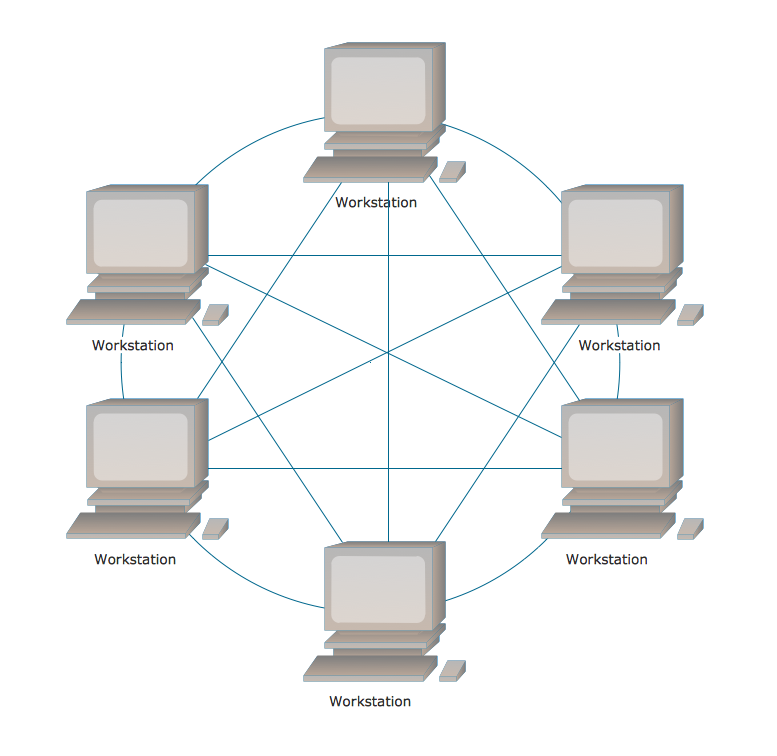
Fully Connected Network Topology Diagram
 Event-driven Process Chain Diagrams
Event-Driven Process Chain Diagrams solution extends ConceptDraw DIAGRAM functionality with event driven process chain templates, samples of EPC engineering and modeling the business processes, and a vector shape library for drawing the EPC diagrams and EPC flowcharts of any complexity. It is one of EPC IT solutions that assist the marketing experts, business specialists, engineers, educators and researchers in resources planning and improving the business processes using the EPC flowchart or EPC diagram. Use the EPC solutions tools to construct the chain of events and functions, to illustrate the structure of a business process control flow, to describe people and tasks for execution the business processes, to identify the inefficient businesses processes and measures required to make them efficient.
The Building Blocks Used in EPC Diagrams

- Examples of Flowcharts, Org Charts and More | What Constitutes a ...
- Horizontal Diagram Of Tqm
- How to Create a Bar Chart in ConceptDraw PRO | How to Draw the ...
- How to Create a Line Chart | How to draw Metro Map style ...
- Dotted Arrow Line
- How to Create an IDEF0 Diagram for an Application Development ...
- Design elements - Picture bar graphs | Design elements - Line ...
- How to Create an IDEF0 Diagram for an Application Development ...
- Design elements - Line graphs
- IDEF0 diagram - Tunneled arrows | IDEF0 diagram - Detail ...