This site uses cookies. By continuing to browse the ConceptDraw site you are agreeing to our Use of Site Cookies.

Basic Flowchart Symbols and Meaning

Flowchart Symbols and Meaning - Provides a visual representation of basic flowchart symbols and their proposed use in professional workflow diagram, standard process flow diagram and communicating the structure of a well-developed web site, as well as their correlation in developing on-line instructional projects. See flowchart's symbols by specifics of process flow diagram symbols and workflow diagram symbols.
How to Build a Flowchart

ERD Symbols and Meanings

Crow's foot notation is used in Barker's Notation, Structured Systems Analysis and Design Method (SSADM) and information engineering. Crow's foot diagrams represent entities as boxes, and relationships as lines between the boxes. Different shapes at the ends of these lines represent the cardinality of the relationship.
The Chen's ERD notation is still used and is considered to present a more detailed way of representing entities and relationships.
To create an ERD, software engineers mainly turn to dedicated drawing software, which contain the full notation resources for their specific database design - ERD symbols and meanings. CS Odessa has released an all-inclusive Entity-Relationship Diagram (ERD) solution for their powerful drawing program, ConceptDraw DIAGRAM.
How to Build an Entity Relationship Diagram (ERD)

Entity Relationship Diagram Symbols

Creating an entity-relationship (ER) model is to visually represent the structure of a business database, where data equates to entities (or objects) that are linked by defined relationships expressing dependencies and requirements. By nature it is an abstract visualization, the first step in the design process towards creating a logical and functional database.
ERD symbols used for professional ERD drawing are collected in libraries from the Entity-Relationship Diagram (ERD) solution for ConceptDraw DIAGRAM.

Garrett IA Diagrams with ConceptDraw DIAGRAM

Garrett IA diagrams are used at development of Internet-resources, in particulars at projecting of interactions of web-resource elements. The diagram of information architecture of the web resource which is constructed correctly with necessary details presents to developers the resource in comprehensible and visual way.

Business Process Modeling Software for Mac

ConceptDraw DIAGRAM - business process modeling software for mac offers the Business Process Diagram Solution with powerful tools to help you easy represent the business processes and create the business process diagrams based on BPMN 1.2 and BPMN 2.0 standards that allows to create of both simple and complex (nested) models of processes.
There are 16 BPMN 1.2 and BPMN 2.0 stencil libraries containing 230 vector objects: Rapid Draw library, Connections library, Gateways and Artifacts libraries, Data library, Gateways library, Choreographies library, Conversations library, Activities libraries, Events libraries, Expanded Objects libraries, Swim lanes libraries.

Organizational Charts with ConceptDraw DIAGRAM

With ConceptDraw DIAGRAM, you can quickly and easily create any type of orgchart professional. ConceptDraw DIAGRAM includes numerous organizational chart templates for the simple to complex multi-page charts.

Cross Functional Flowchart Symbols

The excellent possibility to create attractive Cross Functional Flowcharts for step-by-step visualization the operations of a business process flow of any degree of detailing is offered by ConceptDraw’s Cross-Functional Flowcharts solution. The extensive selection of commonly used vector cross functional flowchart symbols allow you to demonstrate the document flow in organization, to represent each team member’s responsibilities and how processes get shared or transferred between different teams and departments.

IDEF0 standard with ConceptDraw DIAGRAM

The activity of any organization is more or less branchy network of processes. The description of these processes is a hard technical task which requires definite methodology and standards.
According to the IDEF0 standard any process can be described in the form of a block (Activity Box) which has inputs and outputs. The process consists in transformation of inputs into outputs under the influence of the management and in the presence of necessary resources. Outputs of the given process later on can be either inputs for the next process or resources, or management means.
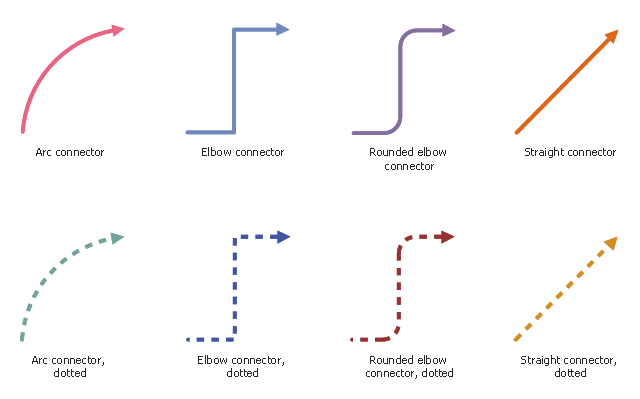
The vector stencils library "Workflow connectors" contains 8 flow lines.
Use it to design your business process workflow diagrams with ConceptDraw PRO software.
"A flowchart is a type of diagram that represents an algorithm, workflow or process, showing the steps as boxes of various kinds, and their order by connecting them with arrows. ...
Flow Line ... An arrow coming from one symbol and ending at another symbol represents that control passes to the symbol the arrow points to. The line for the arrow can be solid or dashed. The meaning of the arrow with dashed line may differ from one flowchart to another and can be defined in the legend." [Flowchart. Wikipedia]
The flowchart arrows example "Design elements - Workflow connectors" is included in the Business Process Workflow Diagrams solution from the Business Processes area of ConceptDraw Solution Park.
Flow lines
Flow lines, straight connector, direct connector, rounded elbow connector, elbow connector, smart connector, arc connector,

Business Process Flow Diagram

Business Process Flow Diagram is a graphical presentation of business processes and process flows. It is one of the main tool of business analysis and business process re-engineering that lets identify and easy understand process flows within organization.
ConceptDraw DIAGRAM extended with Business Process Workflow Diagrams solution from the Business Processes area of ConceptDraw Solution Park is a powerful software which lets easy design Business Process Flow Diagram of any complexity.