Presentations in Educational Process
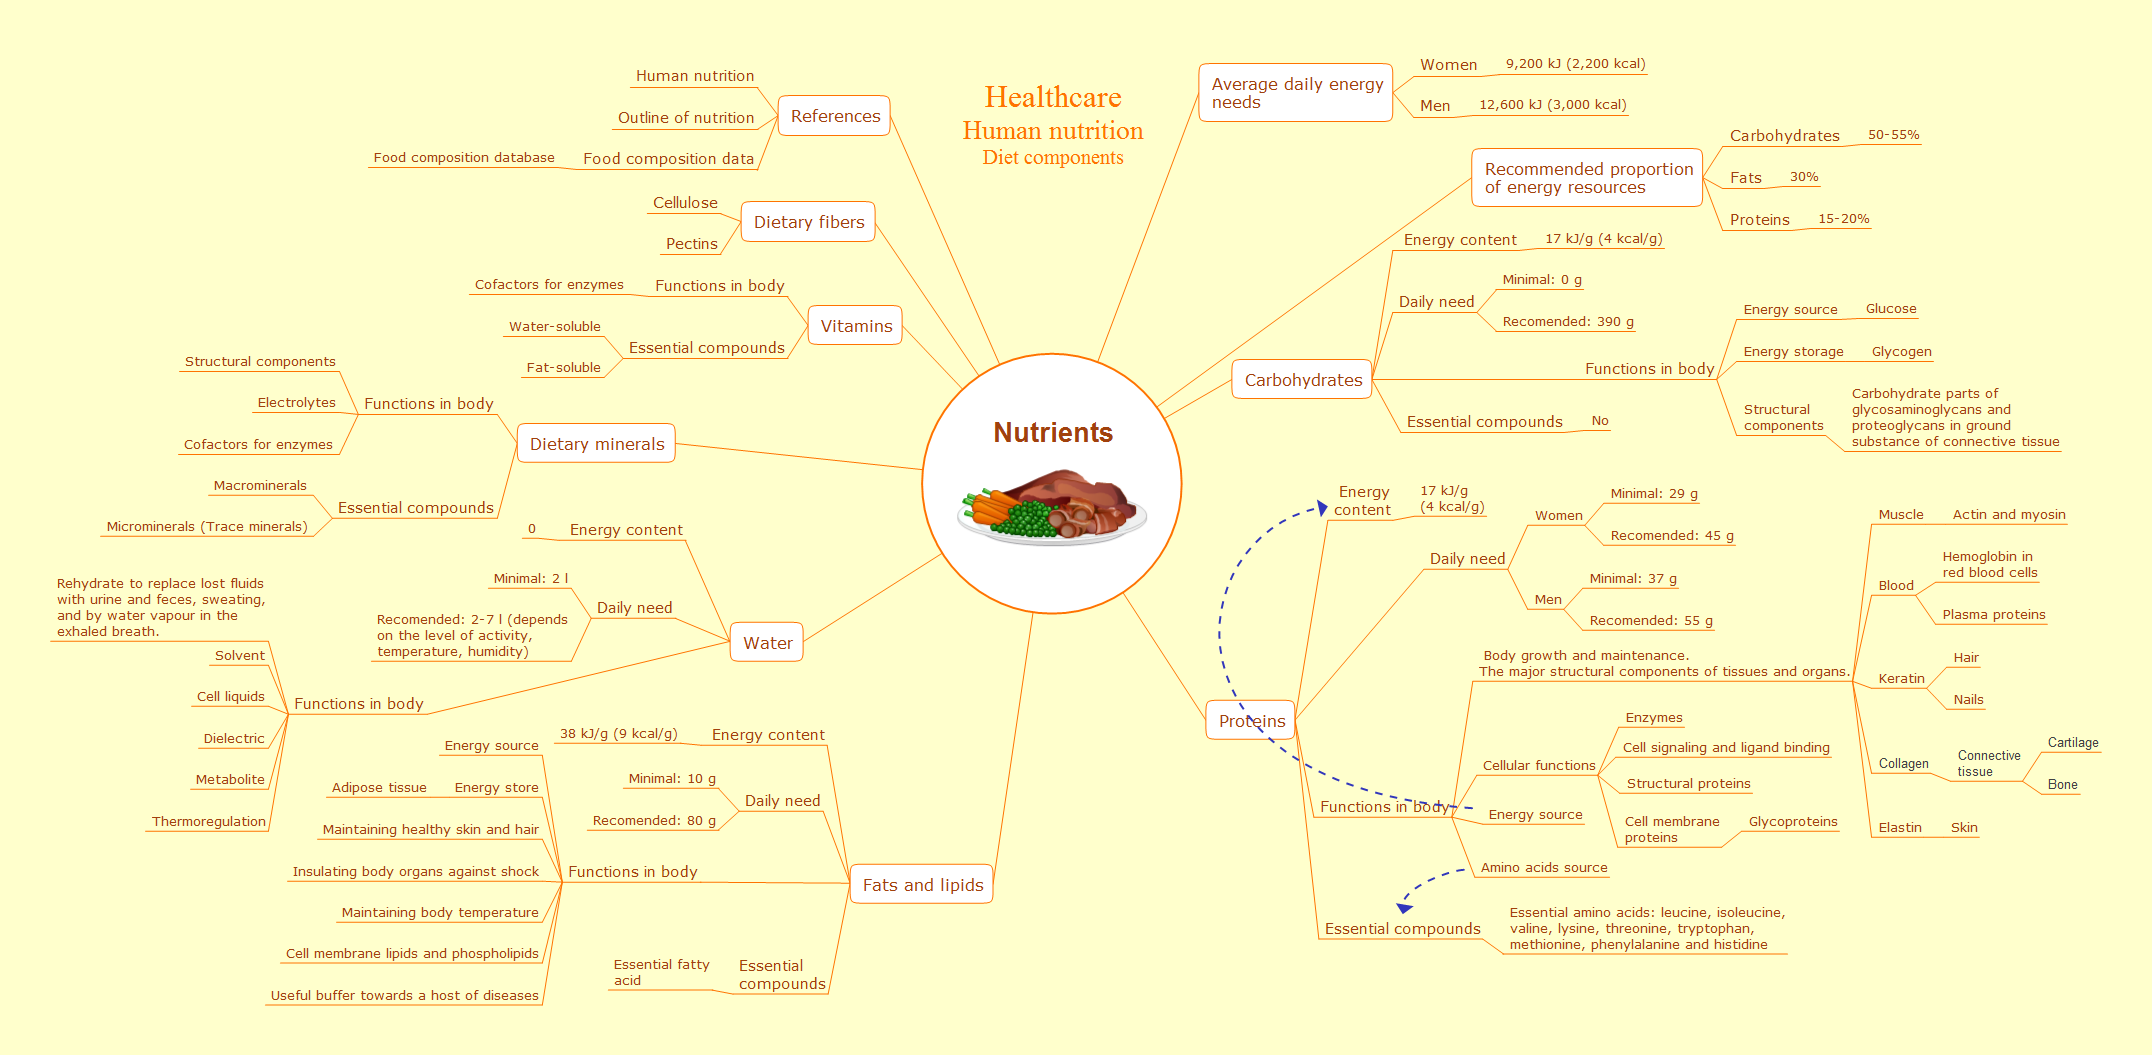
Using mind mapping in education is very popular way to make your lecture materials more structural and clear both for you and for students. At remote learning session your students also can make notes or type questions to the current slides without interrupting slide show.
Balanced Scorecard Software
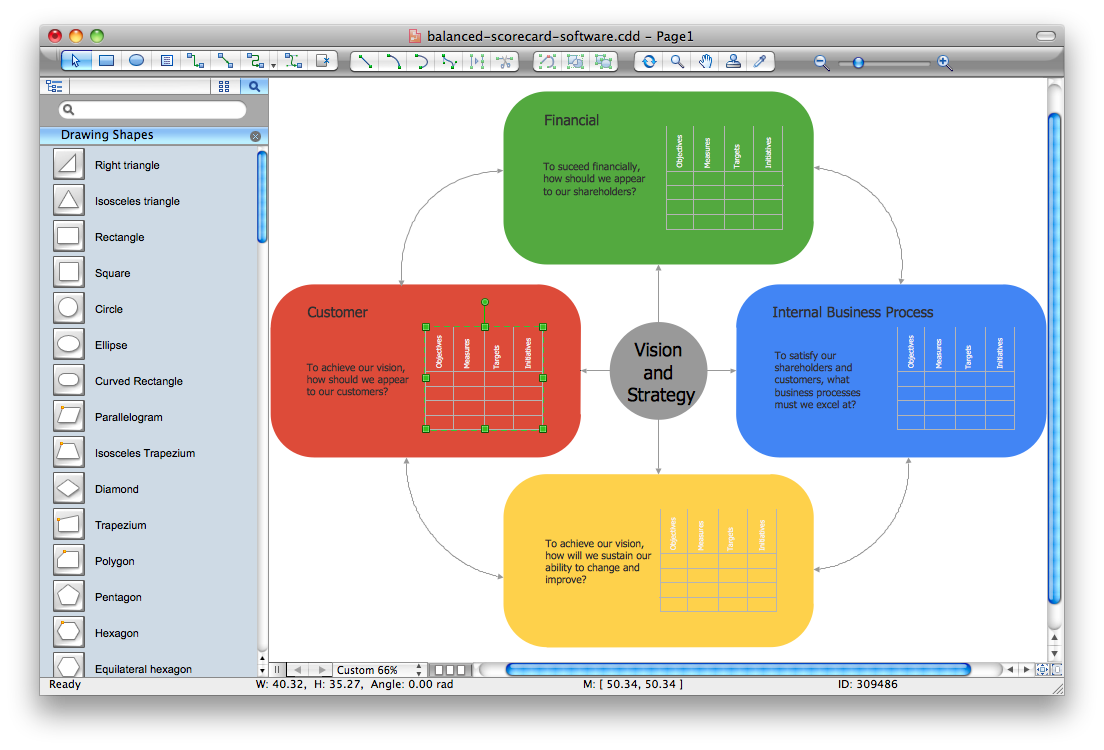
Balanced Scorecard Software provide incredible large variety of samples, templates and libraries of predesigned vector objects. Nothing could be easy that use the predesigned template and fill it, and simply drag the ready-to-use objects for designing your own balanced scorecard diagram.HelpDesk
How to Create Project Dashboard on Mac
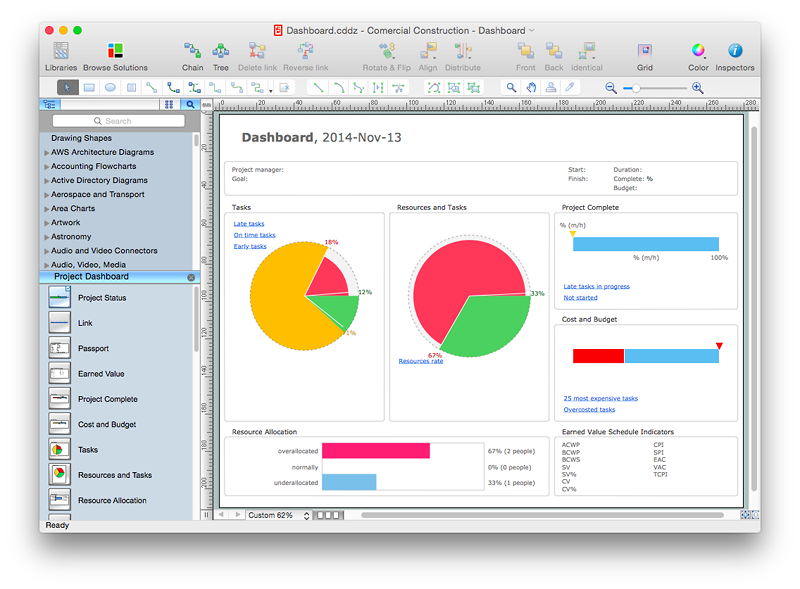
The visual Project Dashboard within ConceptDraw Office is the best way to deliver a clear view of project performance to all project participants.TQM Diagram — Professional Total Quality Management
The Total Quality Management Diagram solution helps you and your organization visualize business and industrial processes. Create Total Quality Management diagrams for business process with ConceptDraw software.HelpDesk
How to Connect Text Data to a Time Series Chart on Your Live Dashboard
Time Series Dashboard means an integration of some type of diagrams: Line Charts, Bar Charts, Column Charts, and Dot Plots on a single space. The ConceptDraw Time Series Dashboard solution can be used to create the interactive Time Series dashboard. The libraries of Time Series Charts solution contain the Live Objects, that can change their appearance depending on the external data. Each chart from the Time Series dashboard displays particular source data. You can include Time Series Charts in your business or technical dashboards to show and compare the items changing over time.
HelpDesk
How to Use ConceptDraw Sales Dashboard Solution
The interactive visual dashboard is a valuable tool for any sales team. Sales dashboard allows you to view and monitor sales indicators that are important for manager and sales staff . It helps to use the timely and reliable information to improve the quality of sales performance and increase sales revenues. ConceptDraw Sales Dashboard solution is a tool for both: sales manager and sales team. It provides the visualization of key performance indicators that are critical to the entire sales organization. The custom sales dashboard displays the real-time information on sales performance KPIs with the help of intuitive and easy-to-understand diagrams and charts. Sales Dashboard helps the entire team see where they are, and what needs to be done. With ConceptDraw PRO you can easily create a visual Sales Dashboard using Live Objects Technology.
Value Stream Mapping for the Lean Office
Value Stream Mapping for the lean office is a tool that uses a flow diagram to document in great detail every step of a manufacturing process.HR Management Software
Human resource management (HRM) is a professional discipline which oversees and manages an organization's human resources, and aspires maximize employee performance for an employer's strategic objectives.The HR Management Software is an incredibly powerful tool for those who need to analyze or present human resource process flows in a visually effective manner.
Human Resource Development
Human Resource Development (HRD) focuses on the help employees develop their personal and organizational skills, abilities, and knowledge, HRD also helps to adapt an organization to the changing of external environment.ConceptDraw PRO diagramming and vector drawing software supplied with HR Flowcharts Solution from the Management Area of ConceptDraw Solution Park can effectively help in labour-intensive process of human resource development.
Customer Relationship Management
Customer relationship management is an important component of sales success. Visualizing sales data you may put some KPI related to customers relationship management to your Sales dashboard and track this important aspect in real time.Create Professional Diagrams Quickly with the New ConceptDraw PRO
If you want to create professional diagrams quickly but don't know how to start, try a professional tool with Rapid Draw ability.This will let you draw a smart and good looking diagrams and charts using its simple RapidDraw option just in clicks.
Take a look on a diagram you are looking for and create it fast and quickly.
Performance Indicators
ConceptDraw PRO diagramming and vector drawing software offers the useful tools of the Sales Dashboard solution from the Marketing area for easy creating professional looking live dashboards which allow to track the business sales activity and progress thanks to representing the Key Performance Indicators (KPIs) on them.What can be Accomplished with EPC Business Diagrams
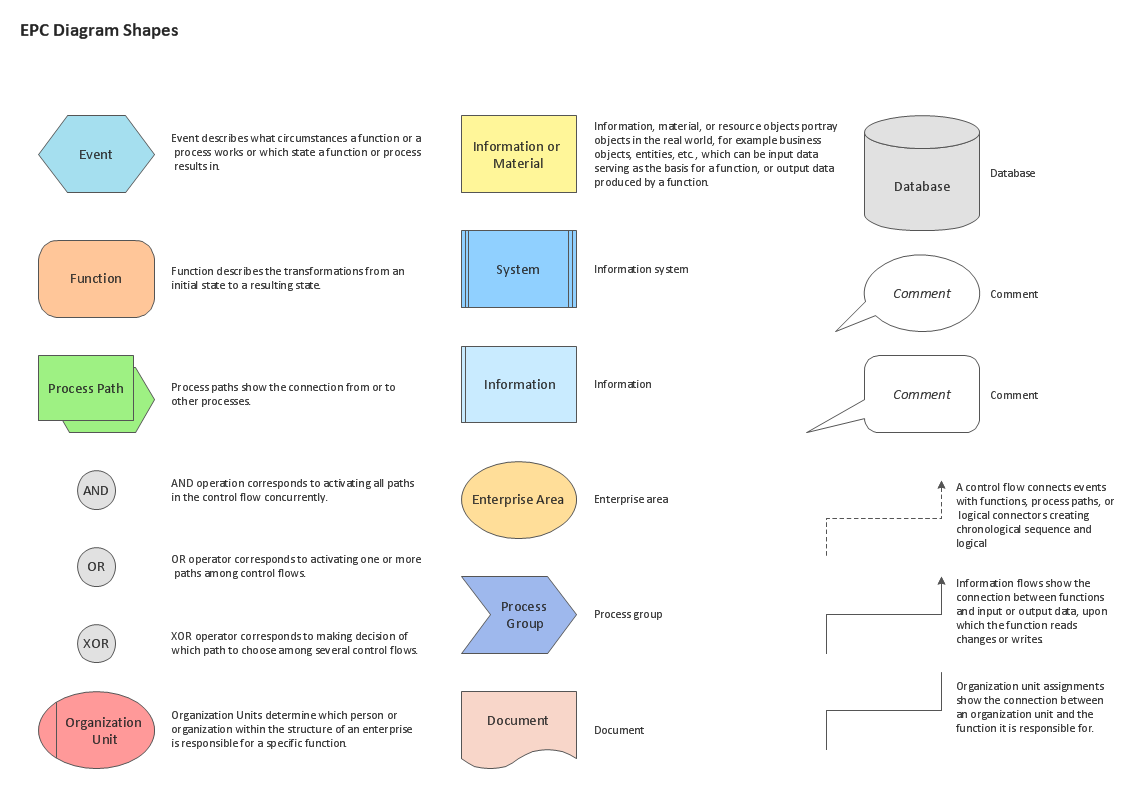
Event-Driven Process chain Diagrams for improvement throughout an organisation.ConceptDraw PRO - software that reduces the time needed to create a business process model.
Relationships Analysis
Relationships Analysis. Relations Diagram - factors analysis, factors relations. Create Relations Diagram with ConceptDraw PRO.The Seven Management and Planning Tools is a tool for Interaction diagram drawing. This diagram identifies causal relationships. Determine what factors are causes and which factors are effects. Interaction diagram helps establish KPIs to monitor changes and the effectiveness of corrective actions in resolving the problem.

- TQM Diagram — Professional Total Quality Management | Constant ...
- Meter Dashboard | ConceptDraw Solution Park | Georgia DOT ...
- Performance Indicators | Constant improvement of key performance ...
- PM Personal Time Management | Schedule pie chart - Daily action ...
- Employee distribution - HR dashboard | Frequency Distribution ...
- Website traffic dashboard | Website KPIs - Visual dashboard ...
- PM Dashboards | Performance Indicators | Enterprise dashboard ...
- Cafe performance metrics vs. air temperature - Visual dashboard ...
- Performance Indicators | PM Dashboards | Design elements - Sales ...
- Risk management - Concept map | The Best Flowchart Software ...
- Website traffic dashboard | Website metrics - Visual dashboard ...
- Sales Dashboard | Sales Process Flowchart. Flowchart Examples ...
- Website traffic dashboard | Website metrics - Visual dashboard ...
- How to Use ConceptDraw Sales Dashboard Solution | How to ...
- Business Management Tools
- How to Create a Sales Dashboard Using ConceptDraw PRO ...
- Sales Dashboard - Access Anywhere | Sales Dashboard | Design ...
- Mind Mapping Quality
- Meter Dashboard | ConceptDraw Solution Park | What is a ...
- Ice Hockey Rink Dimensions | Georgia DOT performance ...
