Typography Art
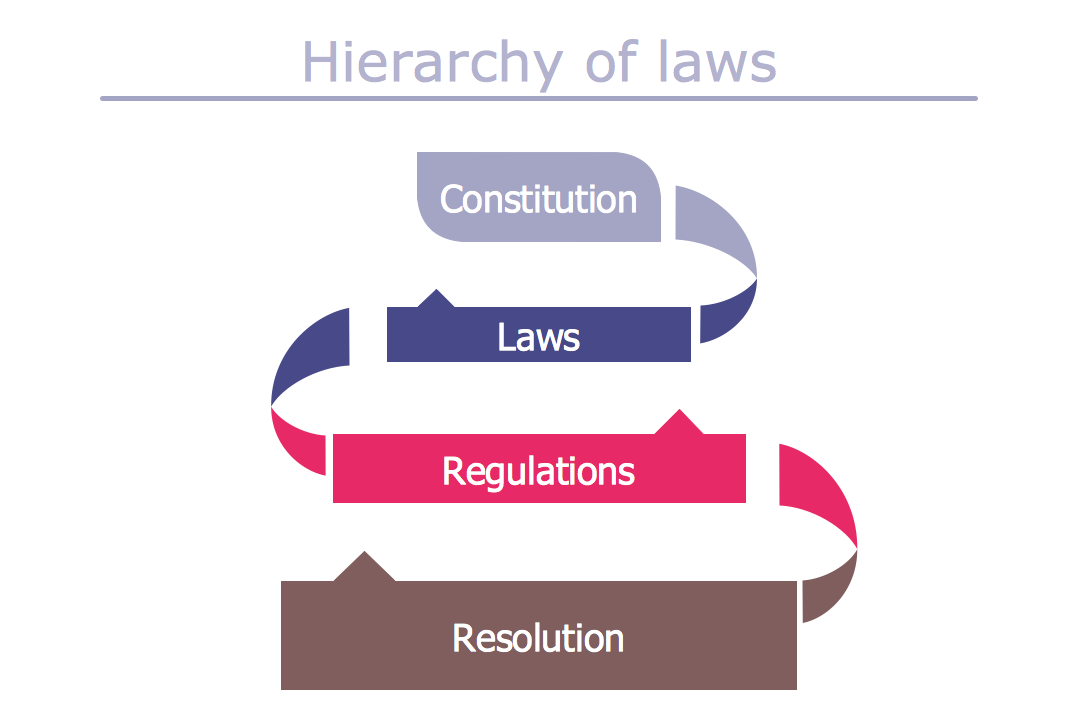
Typography Infographics Solution for ConceptDraw Solution Park is the best answer on the question “How to create an Infographic?”. The Typography Infographics created in ConceptDraw PRO using the Typography Infographics Solution are the real typography art.Typography Graphic
You want design Typography Graphic and need powerful infographic software? Then ConceptDraw PRO extended with Typography Infographics Solution from the “What are Infographics” Area is exactly what you need.Typography Infographics Solution offers you: large quantity of infographic examples;
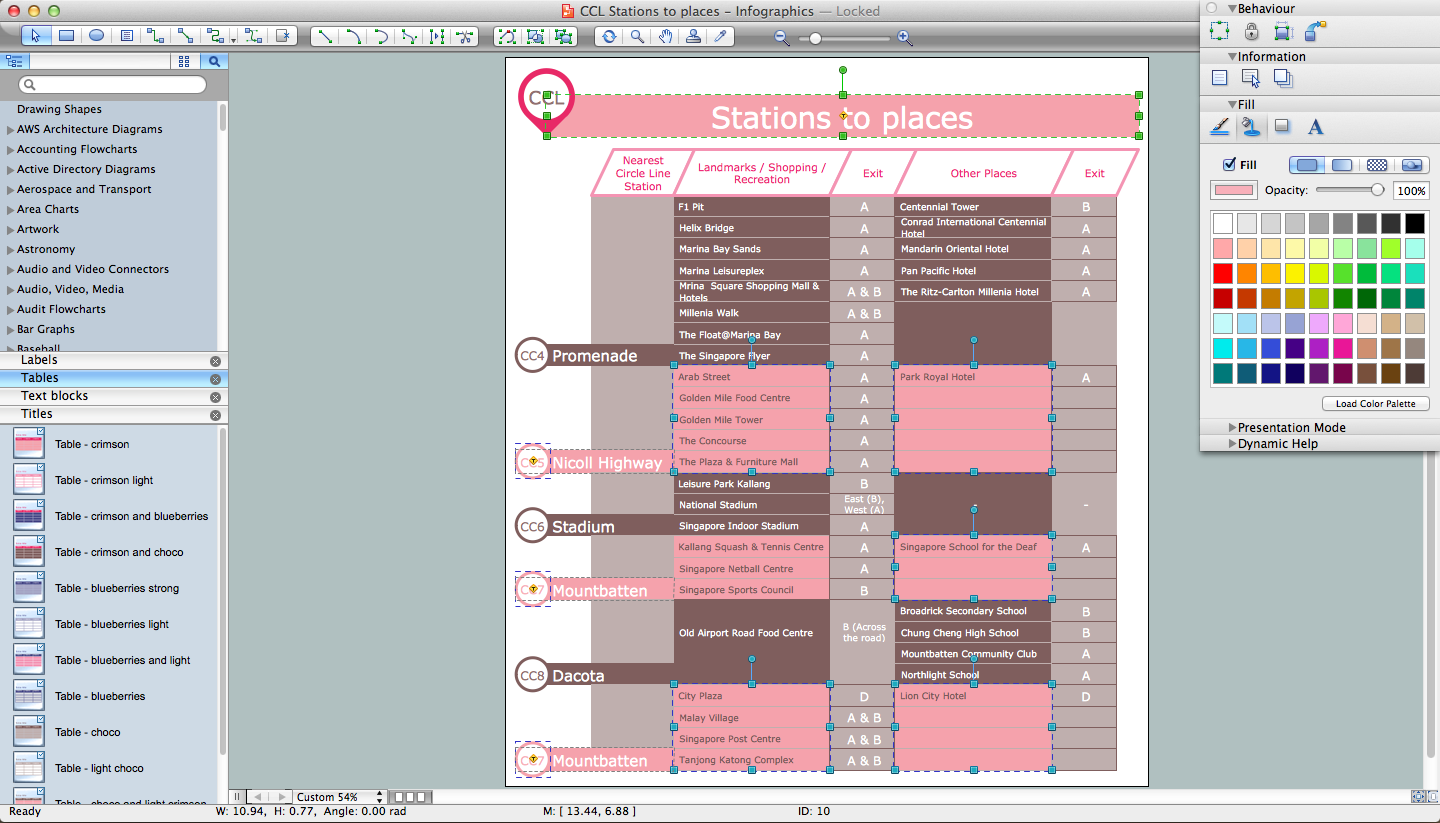
9 libraries with numerous collection of predesigned vector objects that will help you design your own typography graphic of any complexity and design. Use ConceptDraw Solution Browser to quickly get the access for the Typography Infographics Solution tools.
Typography Font
How to create an infographic and make it successful and professional looking? It is a complex process with great quantity of important moments that you should consider. Design and Typography Font play the significant role in the success of typography graphic.Typography Font makes your Typography Infographic unique and attractive. ConceptDraw PRO extended with Typography Infographics Solution from the “What are Infographics” Area provides you the useful tools for simple and quick designing various Typography Infographics.
Typography Infographic Software
ConceptDraw PRO supplied with Typography Infographics Solution from the “What are Infographics” Area is a powerful typography infographic software that provides a set of useful typography infographics tools.Use the Typography Infographics Solution for ConceptDraw PRO typography infographic software to create your own professional looking Typography Infographics of any complexity quick, easy and effective, and then successfully use them in various fields.
Typography Infographic Examples
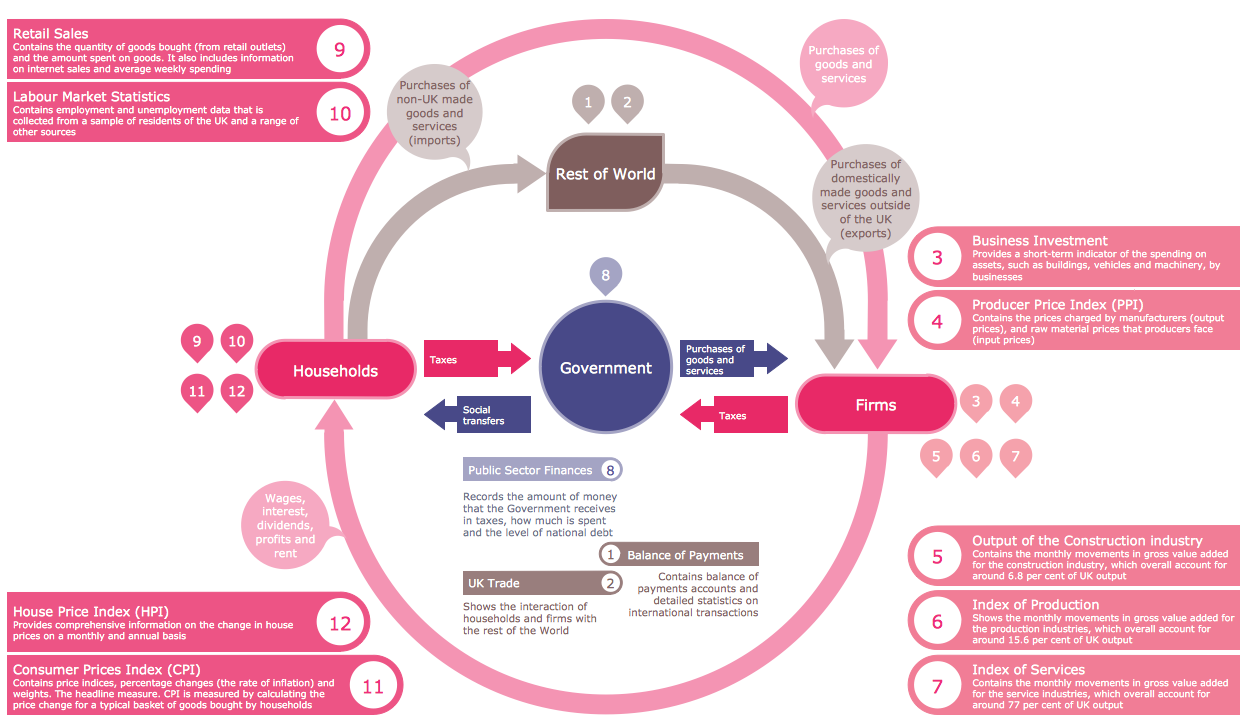
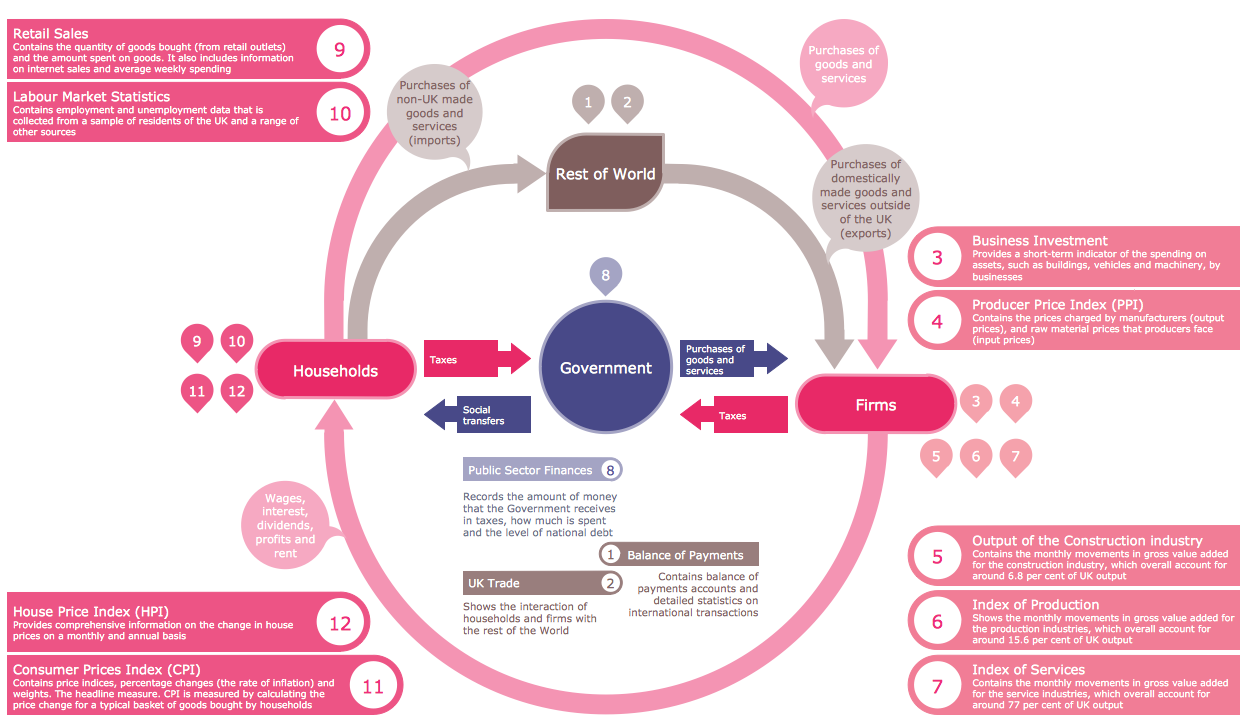
ConceptDraw PRO extended with Typography Infographics Solution from the “What are Infographics” Area is a powerful infographic software that offers you variety of infographics examples.Use of predesigned examples as the base for your own Typography Infographics is a timesaving and useful way. Simply open the desired example, change for your needs and then successfully use it in any field of your activity.
How to Create an Infographic
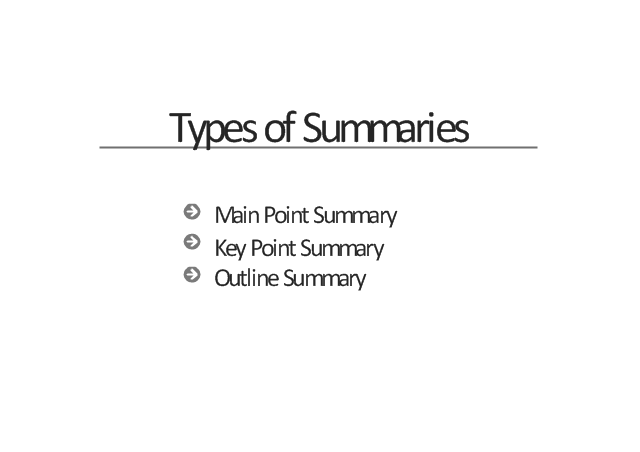
How to Create an Infographic? It’s very easy! All what you need is a powerful infographic software. Never before creation of Infographics wasn’t so easy as now with Typography Infographics Solution from the “What are Infographics” Area for ConceptDraw Solution Park.This presentation slide example contains a list of bullet points.
"In typography, a bullet is a typographical symbol or glyph used to introduce items in a list. ...
It is likely that the name originated from the resemblance of the traditional circular bullet symbol to an actual bullet.
The bullet symbol may take any of a variety of shapes, such as circular, square, diamond, arrow, etc., and typical word processor software offer a wide selection of shapes and colours. Several regular symbols are conventionally used in ASCII-only text or another environments where bullet characters are not available, such as * (asterisk), - (hyphen), . (period), and even o (lowercase O). Of course, when writing by hand, bullets may be drawn in any style. Historically, the index symbol was popular for similar uses." [Bullet (typography). Wikipedia]
The presentation slide example "Types of summaries" was created in the ConceptDraw PRO diagramming and vector drawing software using the Presentation Clipart solution from the Illustration area of ConceptDraw Solution Park.
 ConceptDraw Solution Park
ConceptDraw Solution Park collects graphic extensions, examples and learning materials
 Organizational Charts
Organizational Charts solution extends ConceptDraw PRO software with samples, templates and library of vector stencils for drawing the org charts.
 Bar Graphs
The Bar Graphs solution enhances ConceptDraw PRO v10 functionality with templates, numerous professional-looking samples, and a library of vector stencils for drawing different types of Bar Graphs, such as Simple Bar Graph, Double Bar Graph, Divided Bar Graph, Horizontal Bar Graph, Vertical Bar Graph, and Column Bar Chart.
 Circle-Spoke Diagrams
Examples of subject areas that are well suited to this approach are marketing, business, products promotion, process modeling, market, resource, time, and cost analysis. Circle-Spoke Diagrams are successfully used in presentations, conferences, management documents, magazines, reportages, reviews, reports, TV, and social media.
 SWOT and TOWS Matrix Diagrams
SWOT and TOWS Matrix Diagrams solution extends ConceptDraw PRO and ConceptDraw MINDMAP software with features, templates, samples and libraries of vector stencils for drawing SWOT and TOWS analysis matrices and mind maps.
- Our Partners
- Conceptdraw.com: Mind Map Software, Drawing Tools | Project ...
- Presenting a Slide Show to a Group of People | Benefits and cons of ...
- Design elements - ABC | Artwork | Abc Letters - Conceptdraw.com
- ABC - Vector stencils library | Design elements - ABC | Association ...
- Use Case Diagrams technology with ConceptDraw PRO | Timeline ...
- Flowchart Symbols Accounting. Activity-based costing (ABC ...
- Design elements - Greek letters
