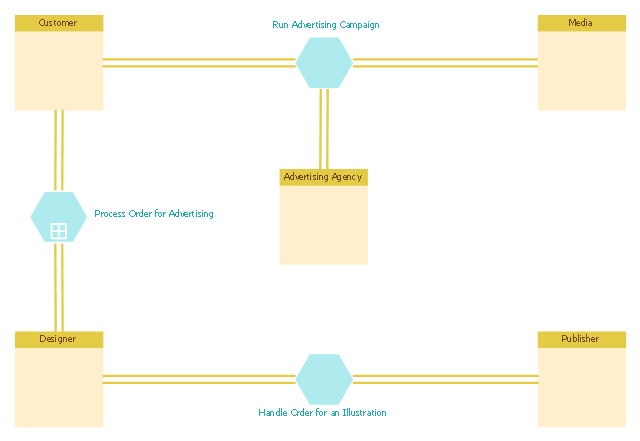
This BPMN (Business Process Model and Notation) diagram sample shows the advertising creation process workflow.
"Types of advertising.
Virtually any medium can be used for advertising. Commercial advertising media can include wall paintings, billboards, street furniture components, printed flyers and rack cards, radio, cinema and television adverts, web banners, mobile telephone screens, shopping carts, web popups, skywriting, bus stop benches, human billboards and forehead advertising, magazines, newspapers, town criers, sides of buses, banners attached to or sides of airplanes ("logojets"), in-flight advertisements on seatback tray tables or overhead storage bins, taxicab doors, roof mounts and passenger screens, musical stage shows, subway platforms and trains, elastic bands on disposable diapers, doors of bathroom stalls, stickers on apples in supermarkets, shopping cart handles (grabertising), the opening section of streaming audio and video, posters, and the backs of event tickets and supermarket receipts. Any place an "identified" sponsor pays to deliver their message through a medium is advertising." [Advertising. Wikipedia]
The business process modeling diagram example "Advertising creation process - Conversation BPMN 2.0 diagram" was designed using the ConceptDraw PRO diagramming and vector drawing software extended with the Business Process Diagram solution from the Business Processes area of ConceptDraw Solution Park.
Business process modeling
"Targeted advertising is a type of advertising whereby advertisements are placed so as to reach consumers based on various traits such as demographics, psychographics, behavioral variables (such as product purchase history), and firmographic variables ... or other second-order activities which serve as a proxy for these traits.
Most targeted new media advertising currently uses second-order proxies for targeting, such as tracking online or mobile web activities of consumers, associating historical webpage consumer demographics with new consumer web page access, using a search word as the basis for implied interest, or contextual advertising.
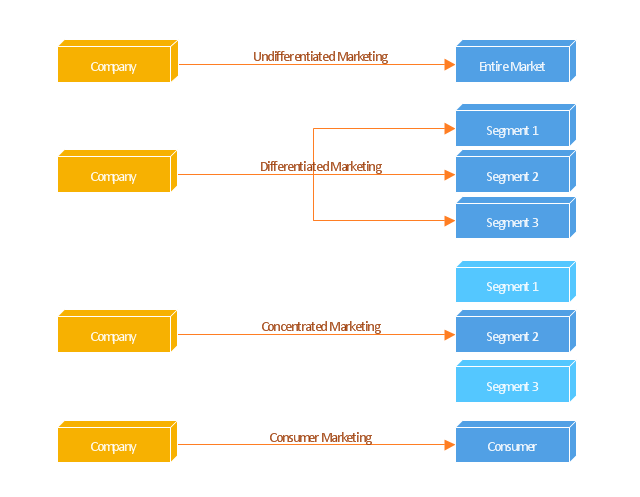
Addressable advertising systems serve ads directly based on demographic, psychographic, or behavioral attributes associated with the consumer(s) exposed to the ad. These systems are always digital and must be addressable in that the end point which serves the ad (set-top box, website, or digital sign) must be capable of rendering an ad independently of any other end points based on consumer attributes specific to that end point at the time the ad is served. Addressable advertising systems therefore must use consumer traits associated with the end points as the basis for selecting and serving ads." [Targeted advertising. Wikipedia]
The block diagram example "Marketing targeting" was created using the ConceptDraw PRO diagramming and vector drawing software extended with the Block Diagrams solution from the area "What is a Diagram" of ConceptDraw Solution Park.
Most targeted new media advertising currently uses second-order proxies for targeting, such as tracking online or mobile web activities of consumers, associating historical webpage consumer demographics with new consumer web page access, using a search word as the basis for implied interest, or contextual advertising.
Addressable advertising systems serve ads directly based on demographic, psychographic, or behavioral attributes associated with the consumer(s) exposed to the ad. These systems are always digital and must be addressable in that the end point which serves the ad (set-top box, website, or digital sign) must be capable of rendering an ad independently of any other end points based on consumer attributes specific to that end point at the time the ad is served. Addressable advertising systems therefore must use consumer traits associated with the end points as the basis for selecting and serving ads." [Targeted advertising. Wikipedia]
The block diagram example "Marketing targeting" was created using the ConceptDraw PRO diagramming and vector drawing software extended with the Block Diagrams solution from the area "What is a Diagram" of ConceptDraw Solution Park.
Block diagram
This Venn diagram sample shows the relations between Internet marketing professions.
"Online advertising, also called Internet advertising, uses the Internet to deliver promotional marketing messages to consumers. It includes email marketing, search engine marketing, social media marketing, many types of display advertising (including web banner advertising), and mobile advertising. Like other advertising media, online advertising frequently involves both a publisher, who integrates advertisements into its online content, and an advertiser, who provides the advertisements to be displayed on the publisher's content. Other potential participants include advertising agencies who help generate and place the ad copy, an ad server who technologically delivers the ad and tracks statistics, and advertising affiliates who do independent promotional work for the advertiser." [Online advertising. Wikipedia]
The diagram example "Internet marketing professions" was created using the ConceptDraw PRO diagramming and vector drawing software extended with the Venn Diagrams solution from the area "What is a Diagram" of ConceptDraw Solution Park.
Venn diagram

Pyramid Diagram

Process Flowchart


BPMN 2.0

Garrett IA Diagrams with ConceptDraw PRO

Types of Flowchart - Overview


Business and Finance Illustrations Example

Example of DFD for Online Store (Data Flow Diagram) DFD Example


Pyramid Diagram

Pyramid Diagram

Fundraising Pyramid

Use Case Diagrams technology with ConceptDraw PRO

Pyramid Diagram

- Types Of Advertising Diagram
- Types Of Advertisements Media Diagrams
- Process Flowchart | Pyramid Diagram | Best Flowcharts | Types Of ...
- Advertising Diagrams
- Advertising creation process - Conversation BPMN 2.0 diagram ...
- Web Diagram Of Types Of Advertisements
- How To Make Flow Chart Of Different Types Of Advertising Diagram
- Advertising Diagram
- Advertising Copy Diagram
- Marketing Diagrams | Marketing Analysis Diagram | Flowchart ...
- Explanation Of Advertising With Help Of Diagrams
- Web Advertising Diagrams
- Target market - Onion diagram | Block diagram - Marketing targeting ...
- Diagram Show Typed Of Advertising
- Diagrams Of Internet Advertising
- Sign Making Software | Flyer Templates | Advertising creation ...
- Design elements - Swimlanes BPMN 2.0 | Advertising creation ...
- Marketing Diagrams | Flowchart Marketing Process. Flowchart ...
- Diagram Chart Advertising