 Timeline Diagrams
Timeline Diagrams solution extends ConceptDraw DIAGRAM diagramming software with samples, templates and libraries of specially developed smart vector design elements of timeline bars, time intervals, milestones, events, today marker, legend, and many other elements with custom properties, helpful for professional drawing clear and intuitive Timeline Diagrams. Use it to design simple Timeline Diagrams and designate only the main project stages, or highly detailed Timeline Diagrams depicting all project tasks, subtasks, milestones, deadlines, responsible persons and other description information, ideal for applying in presentations, reports, education materials, and other documentation.
Project Timeline

How to Make a Timeline

Timeline Examples

Timeline Diagrams

Visual Presentations Made Easy with Diagramming Software


Basic Diagramming Flowchart Software

Rack Rate

The vector stencils library "Timelines and milestones" contains 24 shapes of time scales with start and finish dates, time interval bars with progress indication and brackets, milestone, event and today markers for drawing the timeline diagrams using the ConceptDraw PRO diagramming and vector drawing software.
"A timeline is a way of displaying a list of events in chronological order, sometimes described as a project artifact. It is typically a graphic design showing a long bar labelled with dates alongside itself and (usually) events labelled on points where they would have happened. ...
Another type of timeline is used for project management. In these cases, timelines are used to help team members to know what milestones need to be achieved and under what time schedule. For example, in the case of establishing a project timeline in the implementation phase of the life cycle of a computer system." [Timeline. Wikipedia]
The example "Design elements - Timelines solution" is included in the Timeline Diagrams solution from the Management area of ConceptDraw Solution Park.
Timeline and milestone symbols

Software Flow Chart

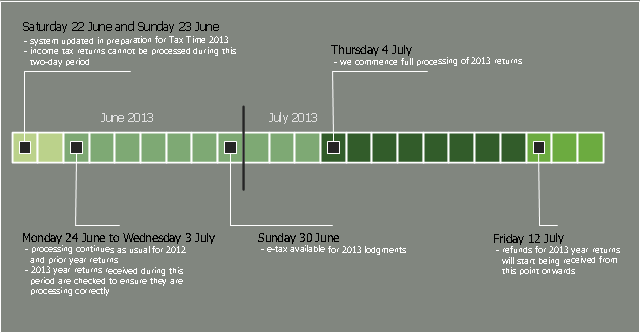
This timeline diagram sample was created on the base of the figure illustrating the webpage "Preparing for Tax Time 2013" from the website of the Australian Taxation Office of the Australian Government. [ato.gov.au/ Tax-professionals/ Prepare-and-lodge/ Tax-Time-2013/ Preparing-for-Tax-Time-2013/ System-availability-and-start-of-return-processing]
"There are many forms of taxation in Australia. Individuals and companies in Australia may be required to pay taxes or charges to all levels of government: local, state, and federal governments. Taxes are collected to pay for public services and transfer payments (redistribution of economic wealth).
Income taxes are the most significant form of taxation in Australia, and collected by the federal government through the Australian Taxation Office. Australian GST revenue is collected by the Federal government, and then paid to the states under a distribution formula determined by the Commonwealth Grants Commission.
Australia maintains a relatively low tax burden in comparison with other wealthy, developed nations, at 25.6% of GDP in 2013." [Taxation in Australia. Wikipedia]
The timeline diagram example "Tax Time 2013 - System availability and processing timeline" was created using the ConceptDraw PRO diagramming and vector drawing software extended with the Timeline Diagrams solution from the Management area of ConceptDraw Solution Park.
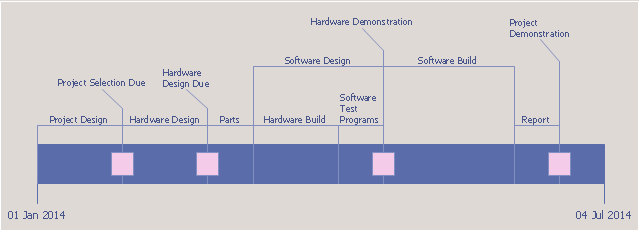
Project timeline
Timeline charts presents events and time periods on a chronological scale. They are used in project management to visualize project milestones and upper level phases, and show project progress.
"... timeline is used for project management. In these cases, timelines are used to help team members to know what milestones need to be achieved and under what time schedule. For example, in the case of establishing a project timeline in the implementation phase of the life cycle of a computer system." [Timeline. Wikipedia]
This project timeline diagram example was created using the ConceptDraw PRO diagramming and vector drawing software extended with the Timeline Diagrams solution from the Management area of ConceptDraw Solution Park.
Project timeline
Decision Making Software For Small Business


Gantt Chart Software

Process Flow app for macOS

The Action Plan


HelpDesk
How to Create a Timeline Diagram

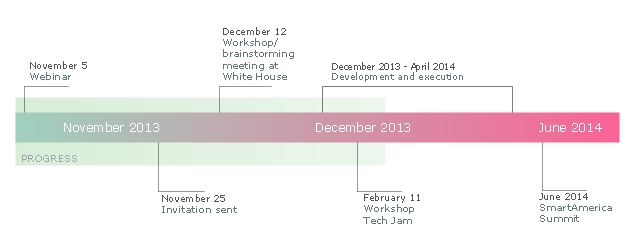
This sample was created on the base of the figure illustrating the webpage "SmartAmerica Challenge Timeline" from the website of the National Institute of Standards and Technology (NIST), an agency of the U.S. Department of Commerce. [nist.gov/ el/ sactl.cfm]
"The SmartAmerica Challenge is a White House Presidential Innovation Fellow project with the goal to bring together research in Cyber-Physical Systems (CPS) and to combine test-beds, projects and activities from different sectors, such as Smart Manufacturing, Healthcare, Smart Energy, Intelligent Transportation and Disaster Response, to show tangible and measurable benefits to the US economy and the daily lives of American citizens.
Cyber-Physical Systems is a name for the combination of the Internet of Things and System Control. So rather than just being able to “sense” where something is, CPS adds the capability to control the “thing” or allow it to interact with physical world around it.
Over 65 Companies, Government Agencies and Academic institutions came together on December 12, 2013 and launched 12 teams/ projects. Since that time 12 new projects have been formed. These teams have been hard at work over the past months building systems, prototypes, pilots and products that demonstrate the capabilities of CPS, but more importantly as the goal of the SmartAmerica Challenge they will show how these technologies will deliver socio-economic benefits to America.
The Challenge will culminate with the SmartAmerica Expo on June 11 at the Washington DC Convention Center." [smartamerica.org/ about/ ]
The timeline diagram example "" was created using the ConceptDraw PRO diagramming and vector drawing software extended with the Timeline Diagrams solution from the Management area of ConceptDraw Solution Park.
Timeline diagram
What Constitutes a Project?


Horizontal Flowchart

- Timeline Diagrams | Software Development Area | How to Create a ...
- Timeline Diagrams | Project Timeline | Timeline Open Source Software
- Project Timeline | How to Make a Timeline | Timeline Graphic Software
- How to Create a Timeline Diagram in ConceptDraw PRO | How to ...
- How to Create a Timeline Diagram in ConceptDraw PRO | Design ...
- Design elements - Timelines and milestones | Design elements ...
- Timeline Examples | Project Timeline | Timeline Diagrams | Visio ...
- Timeline Diagrams | How to Create a Timeline Diagram | Activity ...
- | Project Timeline | Project Timeline Planning Software
- How to Create a Timeline Diagram in ConceptDraw PRO | Plant ...