 Timeline Diagrams
Timeline Diagrams solution extends ConceptDraw DIAGRAM diagramming software with samples, templates and libraries of specially developed smart vector design elements of timeline bars, time intervals, milestones, events, today marker, legend, and many other elements with custom properties, helpful for professional drawing clear and intuitive Timeline Diagrams. Use it to design simple Timeline Diagrams and designate only the main project stages, or highly detailed Timeline Diagrams depicting all project tasks, subtasks, milestones, deadlines, responsible persons and other description information, ideal for applying in presentations, reports, education materials, and other documentation.
The Action Plan


"A project plan, according to the Project Management Body of Knowledge, is: "...a formal, approved document used to guide both project execution and project control. The primary uses of the project plan are to document planning assumptions and decisions, facilitate communication among stakeholders, and document approved scope, cost, and schedule baselines. A project plan may be summarized or detailed." ...
The objective of a project plan is to define the approach to be used by the Project team to deliver the intended project management scope of the project.
At a minimum, a project plan answers basic questions about the project:
Why? - What is the problem or value proposition addressed by the project? Why is it being sponsored?
What? - What is the work that will be performed on the project? What are the major products/ deliverables?
Who? - Who will be involved and what will be their responsibilities within the project? How will they be organized?
When? - What is the project timeline and when will particularly meaningful points, referred to as milestones, be complete?" [Project plan. Wikipedia]
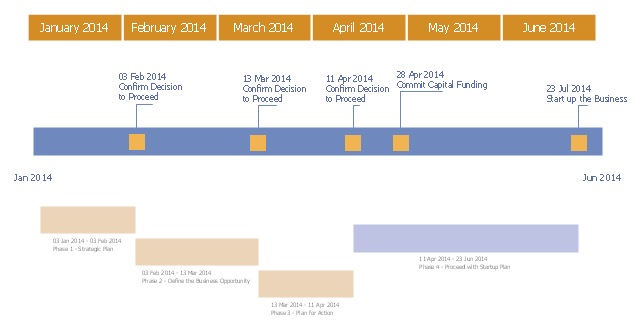
The timeline diagram example "New business project plan" was created using the ConceptDraw PRO diagramming and vector drawing software extended with the Timeline Diagrams solution from the Management area of ConceptDraw Solution Park.
The objective of a project plan is to define the approach to be used by the Project team to deliver the intended project management scope of the project.
At a minimum, a project plan answers basic questions about the project:
Why? - What is the problem or value proposition addressed by the project? Why is it being sponsored?
What? - What is the work that will be performed on the project? What are the major products/ deliverables?
Who? - Who will be involved and what will be their responsibilities within the project? How will they be organized?
When? - What is the project timeline and when will particularly meaningful points, referred to as milestones, be complete?" [Project plan. Wikipedia]
The timeline diagram example "New business project plan" was created using the ConceptDraw PRO diagramming and vector drawing software extended with the Timeline Diagrams solution from the Management area of ConceptDraw Solution Park.
Project timeline
 Project Management Package
Project Management Package includes a large set of graphical solutions from the ConceptDraw Solution Park. They are selected specially to help in completing the business and management goals, creating business models and modeling business processes, analyzing business progress and efficiency of projects implementation. The tools of this package's solutions are helpful to create number of diagrams and dashboards including Management Diagrams, Business diagrams, Bubble diagrams, Circle-spoke diagrams, Circular arrows diagrams, Venn diagrams, Scrum charts, Kanban boards, Business Intelligence maps, Business Metric charts, Dynamic charts, Project diagrams, Hierarchical charts, Influence diagrams, Work Breakdown Structures (WBS), Resource Breakdown Structures (RBS), PERT Diagrams, Project management charts, Project timelines, Gantt Charts, Funnel diagrams, Stakeholder Onion diagrams, and many more.
Calendar Templates

 Seven Management and Planning Tools
Seven Management and Planning Tools solution extends ConceptDraw DIAGRAM and ConceptDraw MINDMAP with features, templates, samples and libraries of vector stencils for drawing management mind maps and diagrams.
 PM Planning
The PM Planning solution extends the functional abilities of ConceptDraw MINDMAP and ConceptDraw PROJECT software, allowing to automatically create the spreadsheets reflecting the tasks and project statuses for people who have different project roles. The reporting capabilities of this solution are represented by the possibility to generate a wide range of project reports that allow the project managers, senior management and other project participants to be informed on a project daily progress and monthly objectives: All Inclusive Report, All Visible Columns, Milestones with Notes and Objectives, Projects Goals, Projects Managers, Project Team, and Top Level Tasks. The PM Planning solution from ConceptDraw Solution Park is a strong project management and productivity tool which simplifies the process of reporting and lets one create a document with the desired report, includes the predesigned examples, extends and improves the planning capabilities for all team members, improves the project communication, helps to accurately plan, maintain, and finish projects on time, to track the work of project resources, to perform the analytical work and to make effective decisions.
Timeline Examples

How to Make a Timeline

What Constitutes a Project?


Gantt Chart Software

"Project planning is part of project management, which relates to the use of schedules such as Gantt charts to plan and subsequently report progress within the project environment.
Initially, the project scope is defined and the appropriate methods for completing the project are determined. Following this step, the durations for the various tasks necessary to complete the work are listed and grouped into a work breakdown structure. Project planning is often used to organize different areas of a project, including project plans, work loads and the management of teams and individuals. The logical dependencies between tasks are defined using an activity network diagram that enables identification of the critical path. Float or slack time in the schedule can be calculated using project management software. Then the necessary resources can be estimated and costs for each activity can be allocated to each resource, giving the total project cost. At this stage, the project schedule may be optimized to achieve the appropriate balance between resource usage and project duration to comply with the project objectives. Once established and agreed, the project schedule becomes what is known as the baseline schedule. Progress will be measured against the baseline schedule throughout the life of the project. Analyzing progress compared to the baseline schedule is known as earned value management.
The inputs of the project planning phase include the project charter and the concept proposal. The outputs of the project planning phase include the project requirements, the project schedule, and the project management plan." [Project planning. Wikipedia]
The flow chart example "Project planning process" was created using the ConceptDraw PRO diagramming and vector drawing software extended with the Flowcharts solution from the area "What is a Diagram" of ConceptDraw Solution Park.
Flowchart - Project planning process

How to Create Gantt Chart

Project Timeline

Geo Mapping Software Examples - World Map Outline

HelpDesk
What Information to be Displayed in the ConceptDraw PROJECT Gantt Chart View

Corrective Action Planning

Examples of Flowcharts, Org Charts and More


Event-Driven Process Chain Diagram Software

- Project Timeline | Best Project Scheduling Software
- Project Timeline | Software Development Schedule Example
- Gantt charts for planning and scheduling projects | Software ...
- Gantt charts for planning and scheduling projects | Software Project ...
- Project timeline - Request for proposal plan | | Proposal Software ...
- Project Timeline | Gant Chart in Project Management | Gantt charts ...
- Planogram Software and Retail Plan Software | Store Layout ...
- Timeline Examples | Project Timeline | How to Make a Timeline ...
- Project Timeline | Project planning process - Flowchart | How to Use ...