This site uses cookies. By continuing to browse the ConceptDraw site you are agreeing to our Use of Site Cookies.

network topology diagram software, network icons, network diagram template, networking icons available, how to draw a network diagram Computer Network Diagrams

network topology diagram software, network icons, network diagram template, networking icons available, how to draw a network diagram
Computer Network Diagrams solution extends ConceptDraw PRO software with samples, templates and libraries of vector stencils for drawing the computer network topology diagrams.

ConceptDraw Solution Park ConceptDraw Solution Park

ConceptDraw Solution Park
ConceptDraw Solution Park collects graphic extensions, examples and learning materials

event-driven process chain diagram, EPC diagram, process chain flowchart Event-driven Process Chain (EPC) Diagrams

event-driven process chain diagram, EPC diagram, process chain flowchart
Event-driven Process Chain (EPC) Diagram is a type of flowchart widely used for modeling in business engineering and reengineering, business process improvement, and analysis. EPC method was developed within the Architecture of Integrated Information Systems (ARIS) framework.
HelpDesk

How to Connect Text Data to a Time Series Chart on Your Live Dashboard

Time Series Dashboard means an integration of some type of diagrams: Line Charts, Bar Charts, Column Charts, and Dot Plots on a single space. The ConceptDraw Time Series Dashboard solution can be used to create the interactive Time Series dashboard. The libraries of Time Series Charts solution contain the Live Objects, that can change their appearance depending on the external data. Each chart from the Time Series dashboard displays particular source data. You can include Time Series Charts in your business or technical dashboards to show and compare the items changing over time.
ConceptDraw Live Visual Dashboards

Cisco networking, Cisco network icons, Cisco icon Cisco Network Diagrams

Cisco networking, Cisco network icons, Cisco icon
Cisco Network Diagrams solution extends ConceptDraw PRO software with samples, templates and libraries of vector stencils for drawing the Cisco computer network diagrams.
HelpDesk

How to Create a Sales Dashboard Using ConceptDraw PRO

Visual dashboard is a valuable tool for any sales team. Sales dashboard allows you to view and monitor sales indicators that are important for manager and sales staff . It helps to use the timely and reliable information to improve the quality of sales performance and increase sales revenues. ConceptDraw Sales Dashboard solution is a tool for both: sales manager and sales team. It provides the visualization of key performance indicators that are critical to the entire sales organization. The custom sales dashboard displays the real-time information on sales performance KPIs with the help of intuitive and easy-to-understand diagrams and charts.
ConceptDraw Live Visual Dashboards

telecommunication networking, networking and telecommunications, telecommunications network, computer systems networking and telecommunications Telecommunication Network Diagrams

telecommunication networking, networking and telecommunications, telecommunications network, computer systems networking and telecommunications
Telecommunication Network Diagrams solution extends ConceptDraw PRO software with samples, templates and libraries of vector stencils for drawing the diagrams of telecommunication networks.
HelpDesk

How to Make Network Diagram

ConceptDraw PRO allows you to represent and communicate network architecture, topology, and design to engineers, stakeholders and end-users.

workflow diagram software, workflow patterns Workflow Diagrams

workflow diagram software, workflow patterns
Workflow Diagrams solution extends ConceptDraw PRO software with samples, templates and vector stencils library for drawing the work process flowcharts.
HelpDesk

How to Create Cisco Network Diagrams

The easiest way to design Cisco Network diagram using standard Cisco product symbols is using ConceptDraw PRO powered by Cisco Network Diagrams solution.
The Cisco Network Diagrams solution uses Cisco network symbols to to visually document the topology and design of Cisco networks.

computer networks Computer and Networks Area

computer networks
The solutions from Computer and Networks Area of ConceptDraw Solution Park collect samples, templates and vector stencils libraries for drawing computer and network diagrams, schemes and technical drawings.

sales dashboard, sales metrics Sales Dashboard

sales dashboard, sales metrics
Sales Dashboard solution extends ConceptDraw PRO software with templates, samples and library of vector stencils for drawing the visual dashboards of sale metrics and key performance indicators (KPI).

Activity Network (PERT) Chart

Activity Network and Project Evaluation and Review Technique, or PERT, charts are a way of documenting and analyzing the tasks in a project.
This diagram is constructed as part of the process in creating a schedule of corrective actions. The Activity Network Chart (PERT) shows the logical connections and consequence of tasks to be performed. It displays the time period for problem solving and the implementation of all activities through the critical path.
HelpDesk

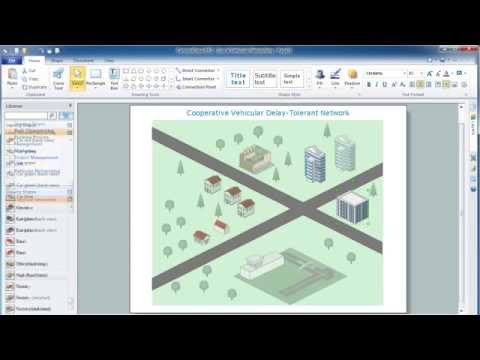
How to Create a Vehicular Network Diagram

ConceptDraw Vehicular Networking solution can help network engineers, network architects to design, analyze and present vehicular network diagrams quickly and efficiently. Solution provides a possibility to swiftly develop conceptual diagrams for vehicular networking. A set of templates and objects delivered with this solution allows making conceptual diagrams of global and local vehicular networks. Using the Vehicular Networking solution makes much easier the work on documenting the Vehicular Networks.
Create Vehicular Network Diagrams
HelpDesk

How To Create a MS Visio Computer Network Diagram Using ConceptDraw PRO

IT professionals are accustomed to use MS Visio for their network diagrams. Nevertheless, ConceptDraw PRO also power, and in some cases and more feature-rich product. Given the fact that many professional people committed to MS Visio, ConceptDraw PRO developers provided users with the opportunity to share their diagrams with MS Visio users. For this you can use the export to VSDX and VSD format. By exporting your network diagram to MS Visio, you can easily solve the issues in communication with the users of this widespread software product.
HelpDesk

How to Add a Telecommunication Network Diagram to a PowerPoint Presentation Using ConceptDraw PRO

Telecommunication network diagram represents a system consisting of computers, servers, telecommunication devices, switches, satellites, wireless transmitters, antennas, cables, etc., that link a set of remote nodes. It is also describes a telephone exchange, that connects calls between landlines. ConceptDraw PRO allows you to easily create telecommunication network diagrams and then make a PowerPoint Presentation from your network documentation in a few clicks. Telecommunication network diagrams are used to show components and connections in a telecommunications network: how they are interacted between each other and with end-users. The PowerPoint presentation on concept of telecom network can be very informative and helpful. ConceptDraw PRO allows you to make a MS PowerPoint Presentation from your telecommunication network diagrams in a few clicks.
HelpDesk

How to Use ConceptDraw Sales Dashboard Solution

The interactive visual dashboard is a valuable tool for any sales team. Sales dashboard allows you to view and monitor sales indicators that are important for manager and sales staff . It helps to use the timely and reliable information to improve the quality of sales performance and increase sales revenues. ConceptDraw Sales Dashboard solution is a tool for both: sales manager and sales team. It provides the visualization of key performance indicators that are critical to the entire sales organization. The custom sales dashboard displays the real-time information on sales performance KPIs with the help of intuitive and easy-to-understand diagrams and charts. Sales Dashboard helps the entire team see where they are, and what needs to be done. With ConceptDraw PRO you can easily create a visual Sales Dashboard using Live Objects Technology.
ConceptDraw Live Visual Dashboards
HelpDesk

How to Create a Computer Network Diagram in ConceptDraw PRO

Computer Network diagram is intended to depict how a computer network is built and connected. It shows how data transfers between connections, and presents an overview of hardware and devices used.
With the Conceptdraw solution for Computer Network Diagrams, system administrators, network architects and other related IT specialists have a perfect drawing tool that supplies adjective vector stencils representing hardware, telecom devices, and logical symbols that enhance possibilities in network diagramming, however complex the real network may be.
HelpDesk

How To Convert a Computer Network Diagram to Adobe PDF Using ConceptDraw PRO

ConceptDraw PRO allows you to easy transmit your network documentation between different computers with different operating systems and applications using it's export capabilities.You can get clear network documentation pack in pdf format and avoid any problems while communicating it with stakeholders.
HelpDesk

How To Add a Computer Network Diagram to a PowerPoint Presentation Using ConceptDraw PRO

The PowerPoint presentation of computer network can be very informative. ConceptDraw PRO allows you to easily create computer network diagrams and then make a PowerPoint Presentation from your network diagrams in a single click.