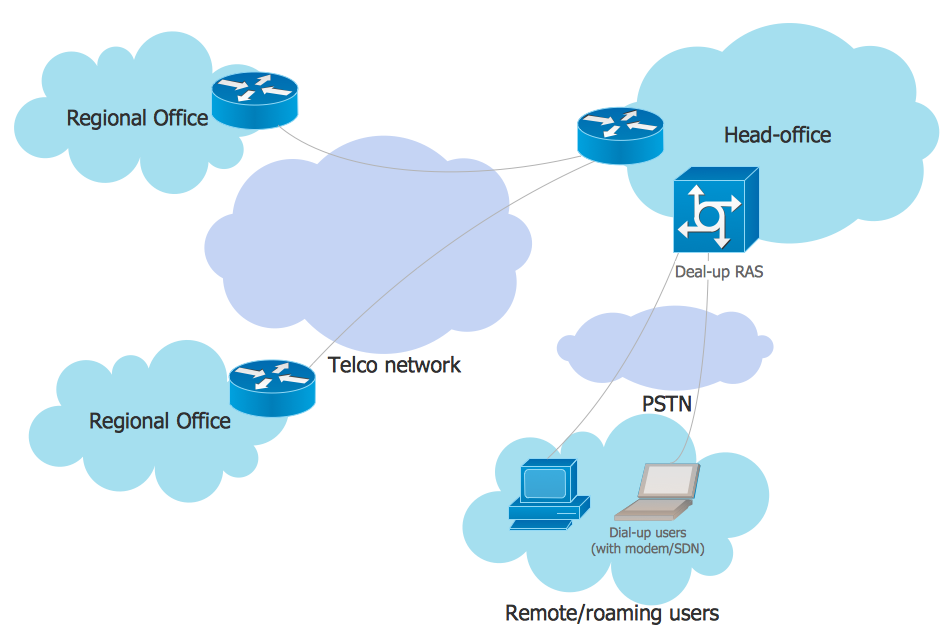
EPN Frame-Relay and Dial-up Network. Computer and Network Examples

The vector stencils library "Meter indicators 2" (for dark background) contains 29 Live Objects: speedometer gauge, dial, bullet, slider and level meter visual indicators.
The Live Objects designed to display actual measures of performance metrics from external data source files. Some of them also display comparative measures, and colored zones of qualitative ranges with legend.
Use this library to create visual dashboards in the ConceptDraw PRO diagramming and vector drawing software extended with the Meter Dashboard solution from the area "What is a Dashboard" of ConceptDraw Solution Park.
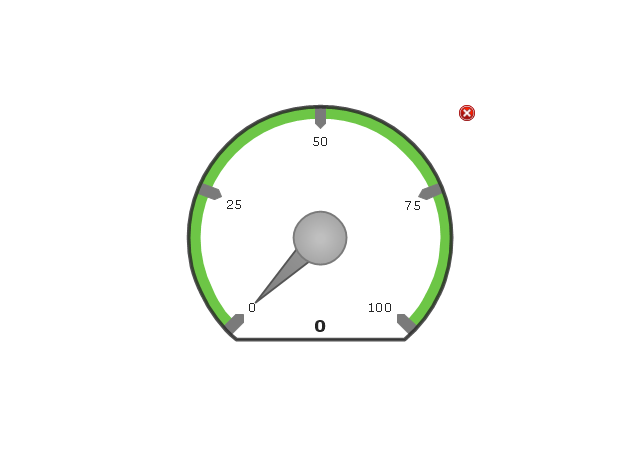
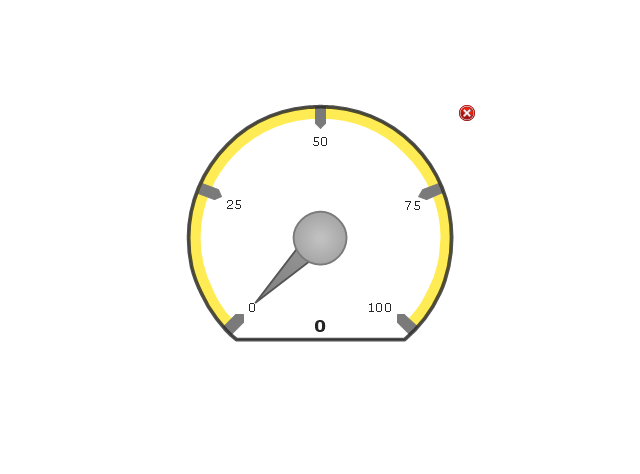
Speedometer Gauge 1

Speedometer Gauge 2
Speedometer Gauge 3
Speedometer Gauge 4
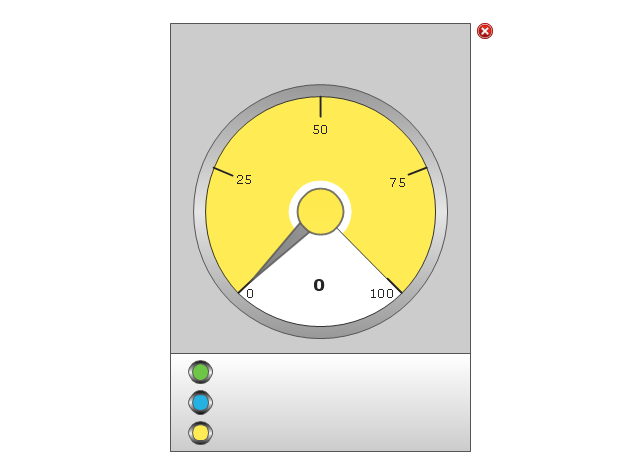
Dial 1
Dial 2
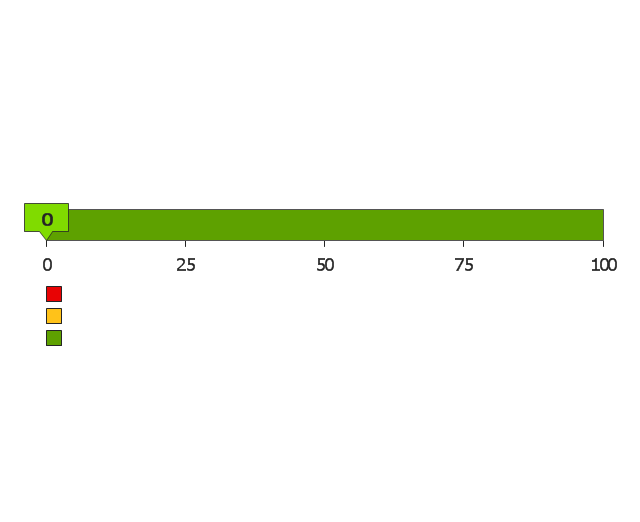
Bullet 1

Bullet 2
Bullet 3
Bullet 4

Bullet 5

Bullet 6

Directed Bullet 1
Directed Bullet 2

Slider Horizontal 1
Slider Horizontal 2
Slider Horizontal 3
Slider Horizontal 4
Slider Vertical 1
Slider Vertical 2
Slider Horizontal 5
Slider Horizontal 6
Slider Horizontal 7
Slider Vertical 3
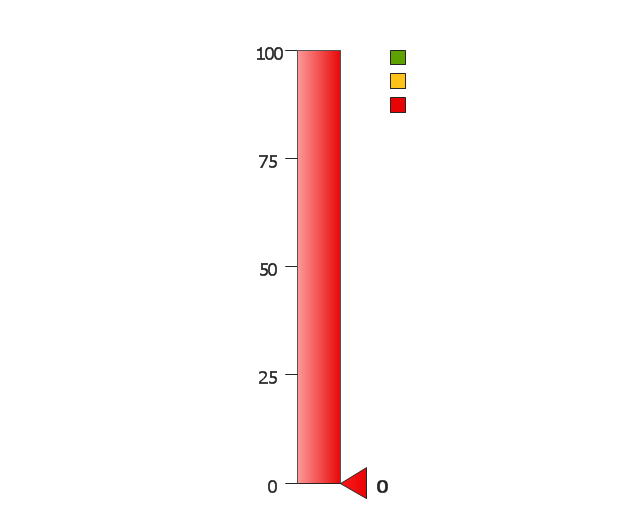
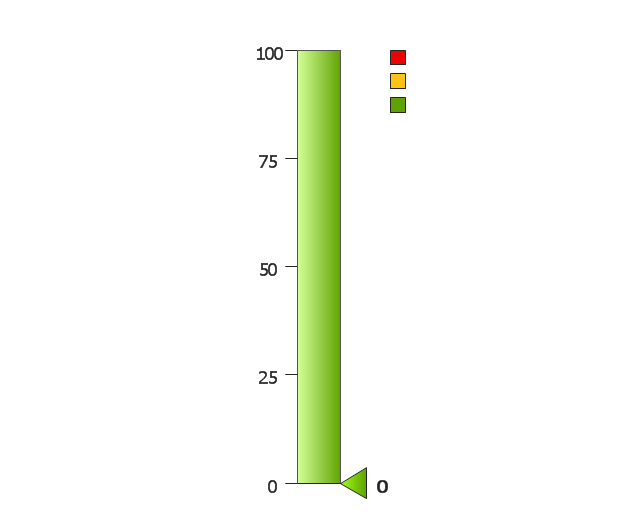
Level Meter 1
Level Meter 2
Level Meter 3
Level Meter 4
Level Meter 5
The vector stencils library "Meter indicators 2" (for dark background) contains 29 Live Objects: speedometer gauge, dial, bullet, slider and level meter visual indicators.
The Live Objects designed to display actual measures of performance metrics from external data source files. Some of them also display comparative measures, and colored zones of qualitative ranges with legend.
Use this library to create visual dashboards in the ConceptDraw PRO diagramming and vector drawing software extended with the Meter Dashboard solution from the area "What is a Dashboard" of ConceptDraw Solution Park.
The Live Objects designed to display actual measures of performance metrics from external data source files. Some of them also display comparative measures, and colored zones of qualitative ranges with legend.
Use this library to create visual dashboards in the ConceptDraw PRO diagramming and vector drawing software extended with the Meter Dashboard solution from the area "What is a Dashboard" of ConceptDraw Solution Park.
Speedometer Gauge 1
Speedometer Gauge 2
Speedometer Gauge 3
Speedometer Gauge 4
Dial 1
Dial 2
Bullet 1
Bullet 2
Bullet 3
Bullet 4
Bullet 5
Bullet 6
Directed Bullet 1
Directed Bullet 2
Slider Horizontal 1
Slider Horizontal 2
Slider Horizontal 3
Slider Horizontal 4
Slider Vertical 1
Slider Vertical 2
Slider Horizontal 5
Slider Horizontal 6
Slider Horizontal 7
Slider Vertical 3
Level Meter 1
Level Meter 2
Level Meter 3
Level Meter 4
Level Meter 5
The vector stencils library "Meter indicators" contains 29 Live Objects: speedometer gauge, dial, bullet, slider and level meter visual indicators.
The Live Objects designed to display actual measures of performance metrics from external data source files. Some of them also display comparative measures, and colored zones of qualitative ranges with legend.
Use this library to create visual dashboards in the ConceptDraw PRO diagramming and vector drawing software extended with the Meter Dashboard solution from the area "What is a Dashboard" of ConceptDraw Solution Park.
Speedometer Gauge 1
Speedometer Gauge 2
Speedometer Gauge 3
Speedometer Gauge 4
Dial 1
Dial 2
Bullet 1
Bullet 2

Bullet 3

Bullet 4
Bullet 5

Bullet 6

Directed Bullet 1
Directed Bullet 2

Slider Horizontal 1
Slider Horizontal 2
Slider Horizontal 3
Slider Horizontal 4
Slider Vertical 1
Slider Vertical 2
Slider Horizontal 5
Slider Horizontal 6
Slider Horizontal 7
Slider Vertical 3
Level Meter 1
Level Meter 2
Level Meter 3

Level Meter 4
Level Meter 5
The vector stencils library "Meter indicators" contains 29 Live Objects: speedometer gauge, dial, bullet graph, slider and level meter visual indicators.
The Live Objects designed to display actual measures of performance metrics and KPIs from external data source files.
Some of them also display comparative measures, and colored zones of qualitative ranges with legend.
Use it to draw business performance dashboards using the ConceptDraw PRO diagramming and vector drawing software .
"Digital dashboards may be laid out to track the flows inherent in the business processes that they monitor. Graphically, users may see the high-level processes and then drill down into low level data. This level of detail is often buried deep within the corporate enterprise and otherwise unavailable to the senior executives. ...
Specialized dashboards may track all corporate functions. Examples include human resources, recruiting, sales, operations, security, information technology, project management, customer relationship management and many more departmental dashboards. ...
Like a car's dashboard (or control panel), a software dashboard provides decision makers with the input necessary to "drive" the business. Thus, a graphical user interface may be designed to display summaries, graphics (e.g., bar charts, pie charts, bullet graphs, "sparklines," etc.), and gauges (with colors similar to traffic lights) in a portal-like framework to highlight important information. ...
Digital dashboards allow managers to monitor the contribution of the various departments in their organization. To gauge exactly how well an organization is performing overall, digital dashboards allow you to capture and report specific data points from each department within the organization, thus providing a "snapshot" of performance." [Dashboard (management information systems). Wikipedia]
The example "Design elements - Meter indicators" is included in the Meter Dashboard solution from the area "What is a Dashboard" of ConceptDraw Solution Park.
Visual indicators

This sale dashboard example contains KPIs and sales effectiveness metrics visual indicators: speedometer gauge, dial, slider, level meter and bullet indicators.
"Sales effectiveness refers to the ability of a company’s sales professionals to “win” at each stage of the customer’s buying process, and ultimately earn the business on the right terms and in the right timeframe.
Improving sales effectiveness is not just a sales function issue; it’s a company issue, as it requires deep collaboration between sales and marketing to understand what’s working and not working, and continuous improvement of the knowledge, messages, skills, and strategies that sales people apply as they work sales opportunities.
Sales effectiveness has historically been used to describe a category of technologies and consulting services aimed at helping companies improve their sales results.
Many companies are creating sales effectiveness functions and have even given people titles such as VP of Sales Effectiveness." [Sales effectiveness. Wikipedia]
The example "Sales metrics and KPIs" was created using the ConceptDraw PRO diagramming and vector drawing software extended with the Meter Dashboard solution from the area "What is a Dashboard" of ConceptDraw Solution Park.
Sales dashboard

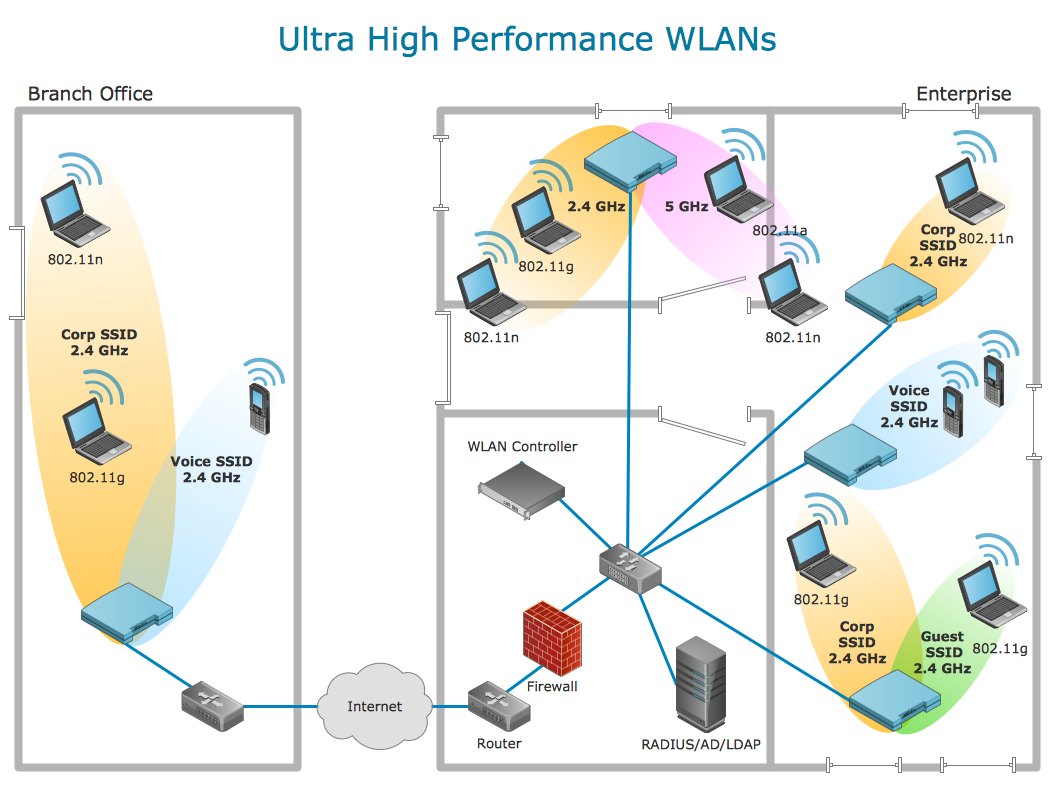
Network Topologies


Network Diagram Software Enterprise Private Network
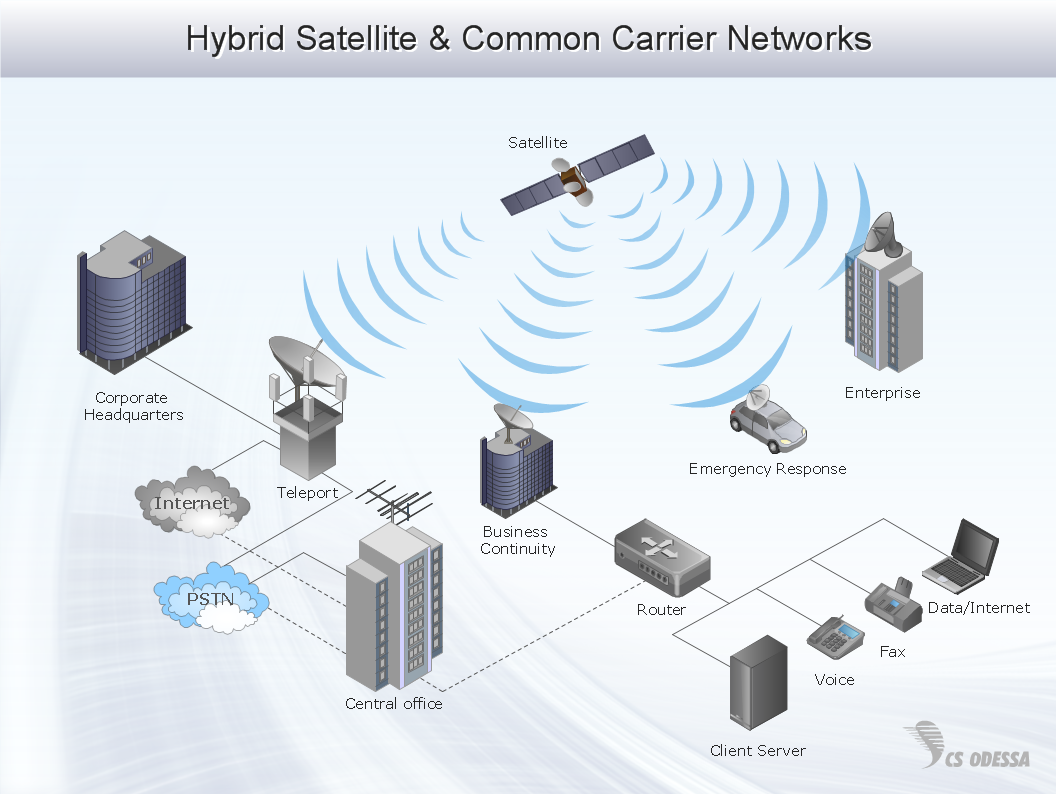
Using Remote Networking Diagrams
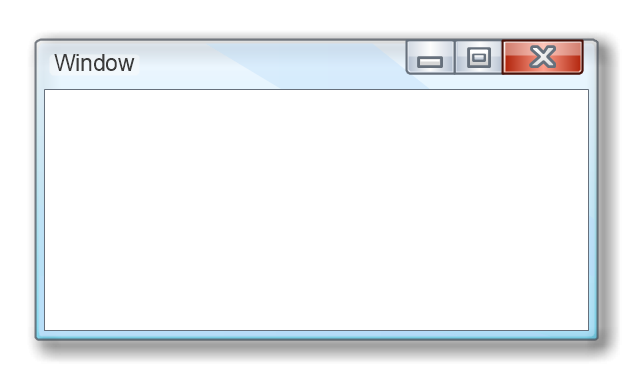
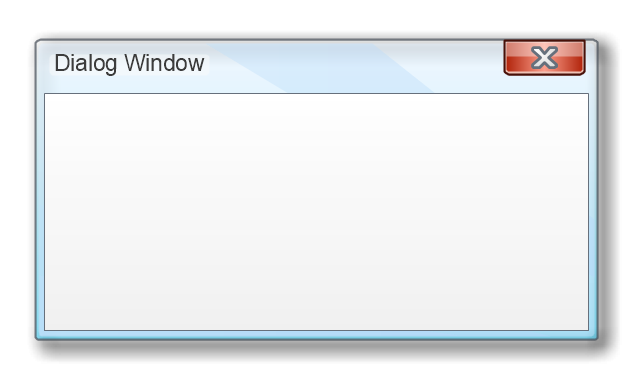
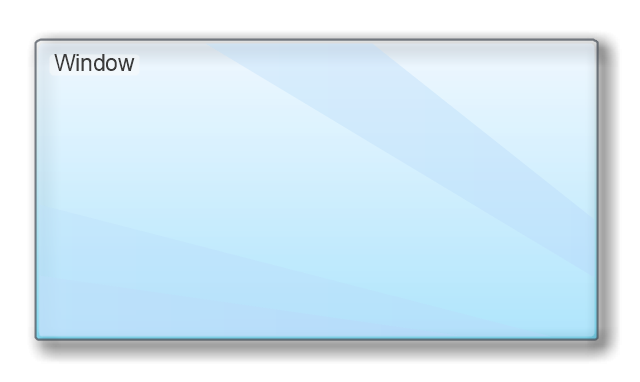
The vector stencils library "MS Windows Vista user interface" contains 76 MS Windows Vista design elements.
Use it for designing Microsoft ribbon graphic user interface (GUI) of software for computers with MS Windows Vista OS in the ConceptDraw PRO diagramming and vector drawing software extended with the Graphic User Interface solution from the Software Development area of ConceptDraw Solution Park.
Use it for designing Microsoft ribbon graphic user interface (GUI) of software for computers with MS Windows Vista OS in the ConceptDraw PRO diagramming and vector drawing software extended with the Graphic User Interface solution from the Software Development area of ConceptDraw Solution Park.
Window
Dialog Window
Empty Window
Field

Horizontal Scrollbar
Vertical Scrollbar
Window Buttons
Window Buttons
Window Button 1
Window Button 2
Window Button 3
Window Button 4

Navigation
Menu Bar
Gradient Menu Bar
Drop-down Menu
Button
Toolbar Pannel
Tool Button
Primary Toolbar

Toolbar 1
Toolbar 2
Customizable Tollbar
Tab View
List View
Text Field
Vertical Separator

Horizontal Separator

Group Box
Text Label

Link

Line Edit
Search

Search with Button

Spin Box
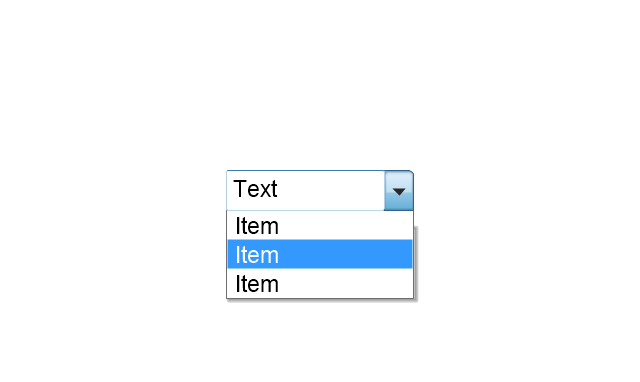
Combo-box
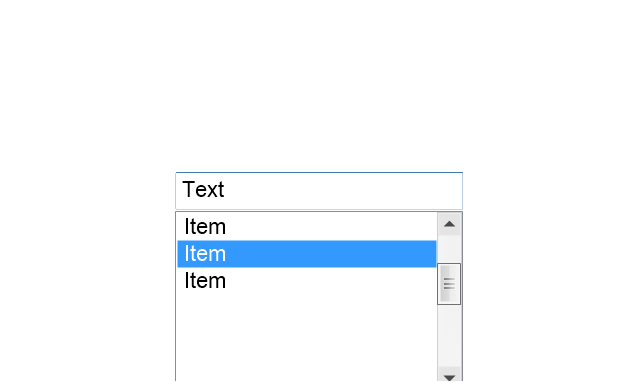
Editable Combo-box
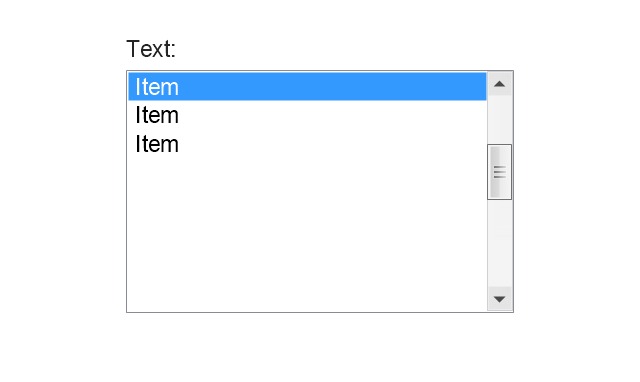
Editable List Box
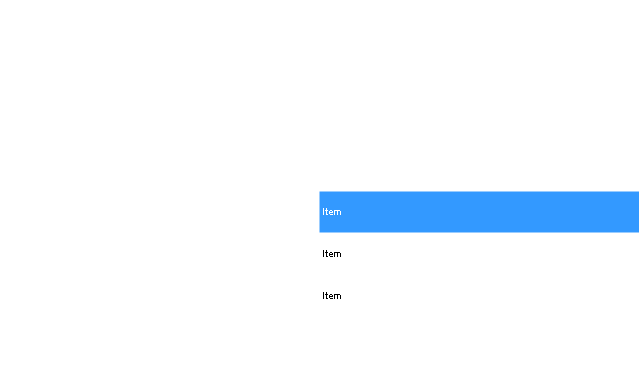
List Box
Single-selection List
Multiple-selection List
Check Box
Radio Button
Check box group
Radio Buttons Group
Progress Bar
Modal Progress Bar

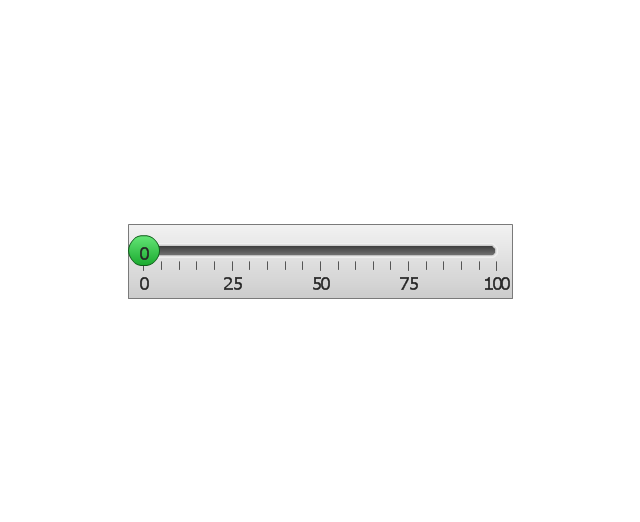
Vertical Slider with Ticks
Horizontal Slider with Ticks
Dial
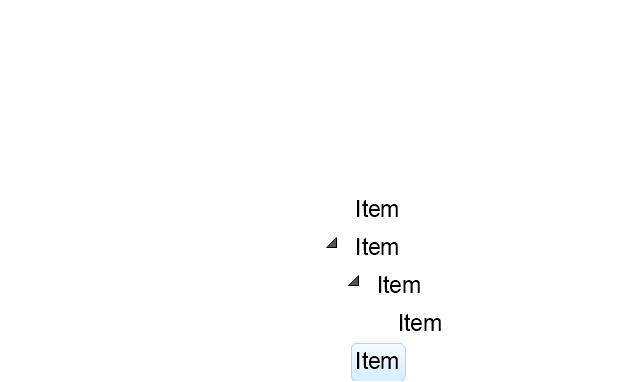
Catalogue Tree
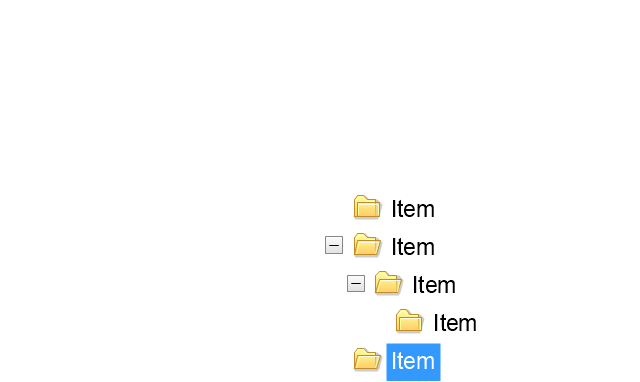
Tree View 1
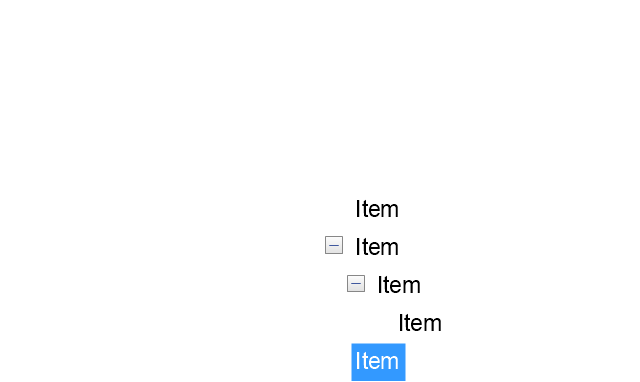
Tree View 2
Vertical Spacer
Horizontal Spacer
Chevron 1
Arrow 1
Arrow 2
Plus/Minus Control

Rotating Triangle

Chevron 3
Chevron 2
Normal Select Cursor

Link Select Cursor

Text Select Cursor

Working in Background Pointer

Busy Pointer

Unavailable Cursor

Precision Select Cursor

Error Icon
Warning Icon
Information Icon
Question Mark Icon
Balloon
Tooltip/Infotip
Calendar
The vector stencils library "Alarm and access control" contains 80 shapes of digital proximity equipment, locking hardware, and access control equipment. Use it for drawing security and access plans of intrusion systems, time and attendance systems, and card and code access control security systems with ConceptDraw PRO software extended with the Security and Access Plans solution from the Building Plans area of ConceptDraw Solution Park.
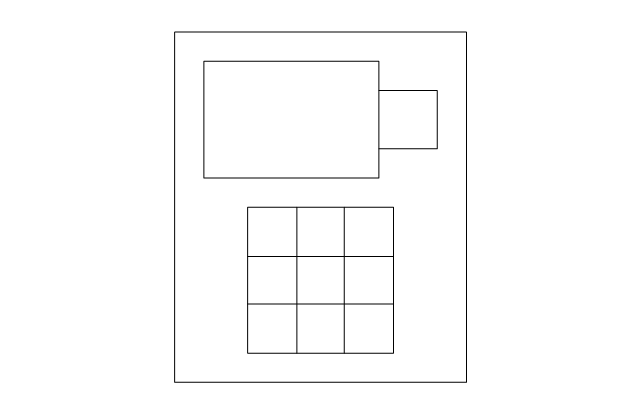
Card reader with keypad
Biometric access
Card access
Keypad device
Keypad
Security keypad
Horn / siren
Weatherproof horn / siren
Horn / strobe
Strobe
Card reader with time
Turnstile
Revolving door
Traffic arm
Vehicle loop detector
Smoke detector
Heat detector
Gas detector
Carbon monoxide detector
Flood sensor

Electronic lock
Exit device
Pushbutton
Panic button

Camera with keypad
Camera
Camera with intercom
Camera with card reader
Security window screen
Window contact sensor
Vibration / shock sensor
Screen alarm
Glass break detector
Door contact sensor
Floor mat

Driveway sensor
Overhead door contact sensor
Wall motion sensor
Floor motion sensor

Security control unit
Security door contact
Security control panel
Security card reader
Motion detector

Master intercom

Magnetic lock, security door alarm
Intercom unit
Electric door strike
Electric door opener
Door buzzer
Door chime
Doorbell
Volumetric capacity detector
Siren
Receiver

PIR field of view

Mains supply power source
Infrared detector
Heat detector
Foil on glass detector
Dial-up remote equipment
Beam fence disturbance
User control keyswitch
User control digital keypad
Ultrasonic transceiver
Transformer
Space detection device
Slave tape dialer
Slave digital communicator
Remote zone annunciator
Passive infrared
Microwave transceiver
Line cut monitor
Infrasonic
Foil

Emergency power / battery
Dual technology device
Control unit

Contact switch surface
Contact switch flush
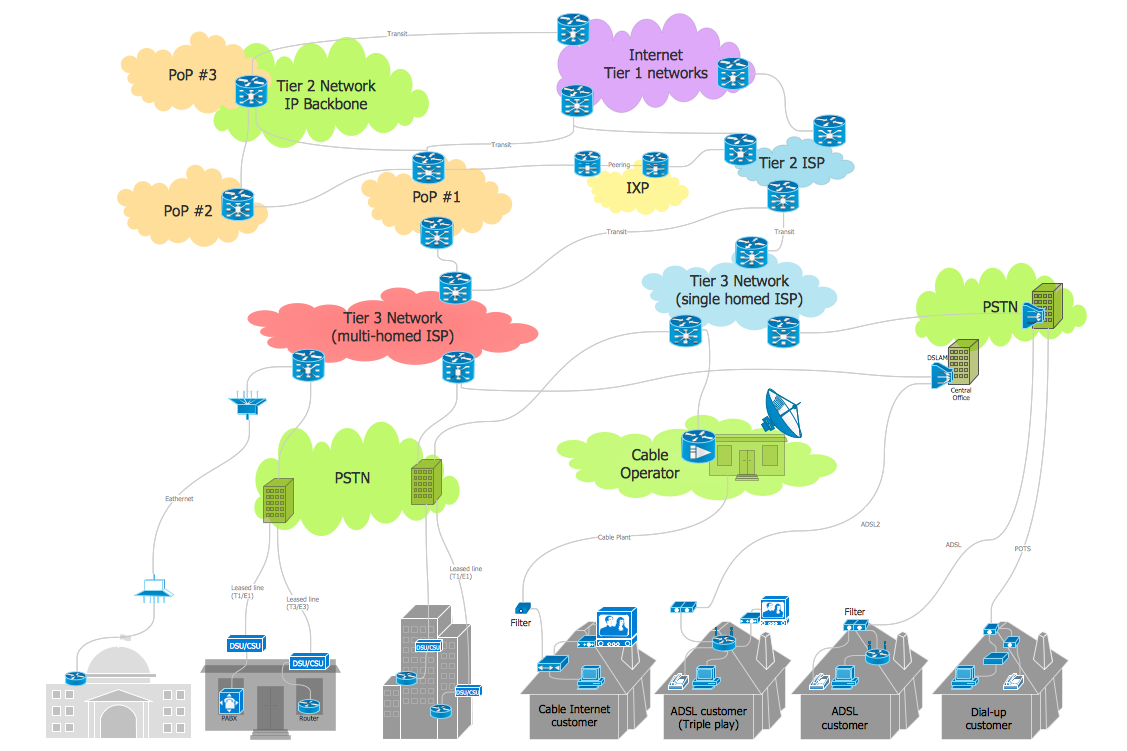
Internet Connectivity. Computer and Network Examples
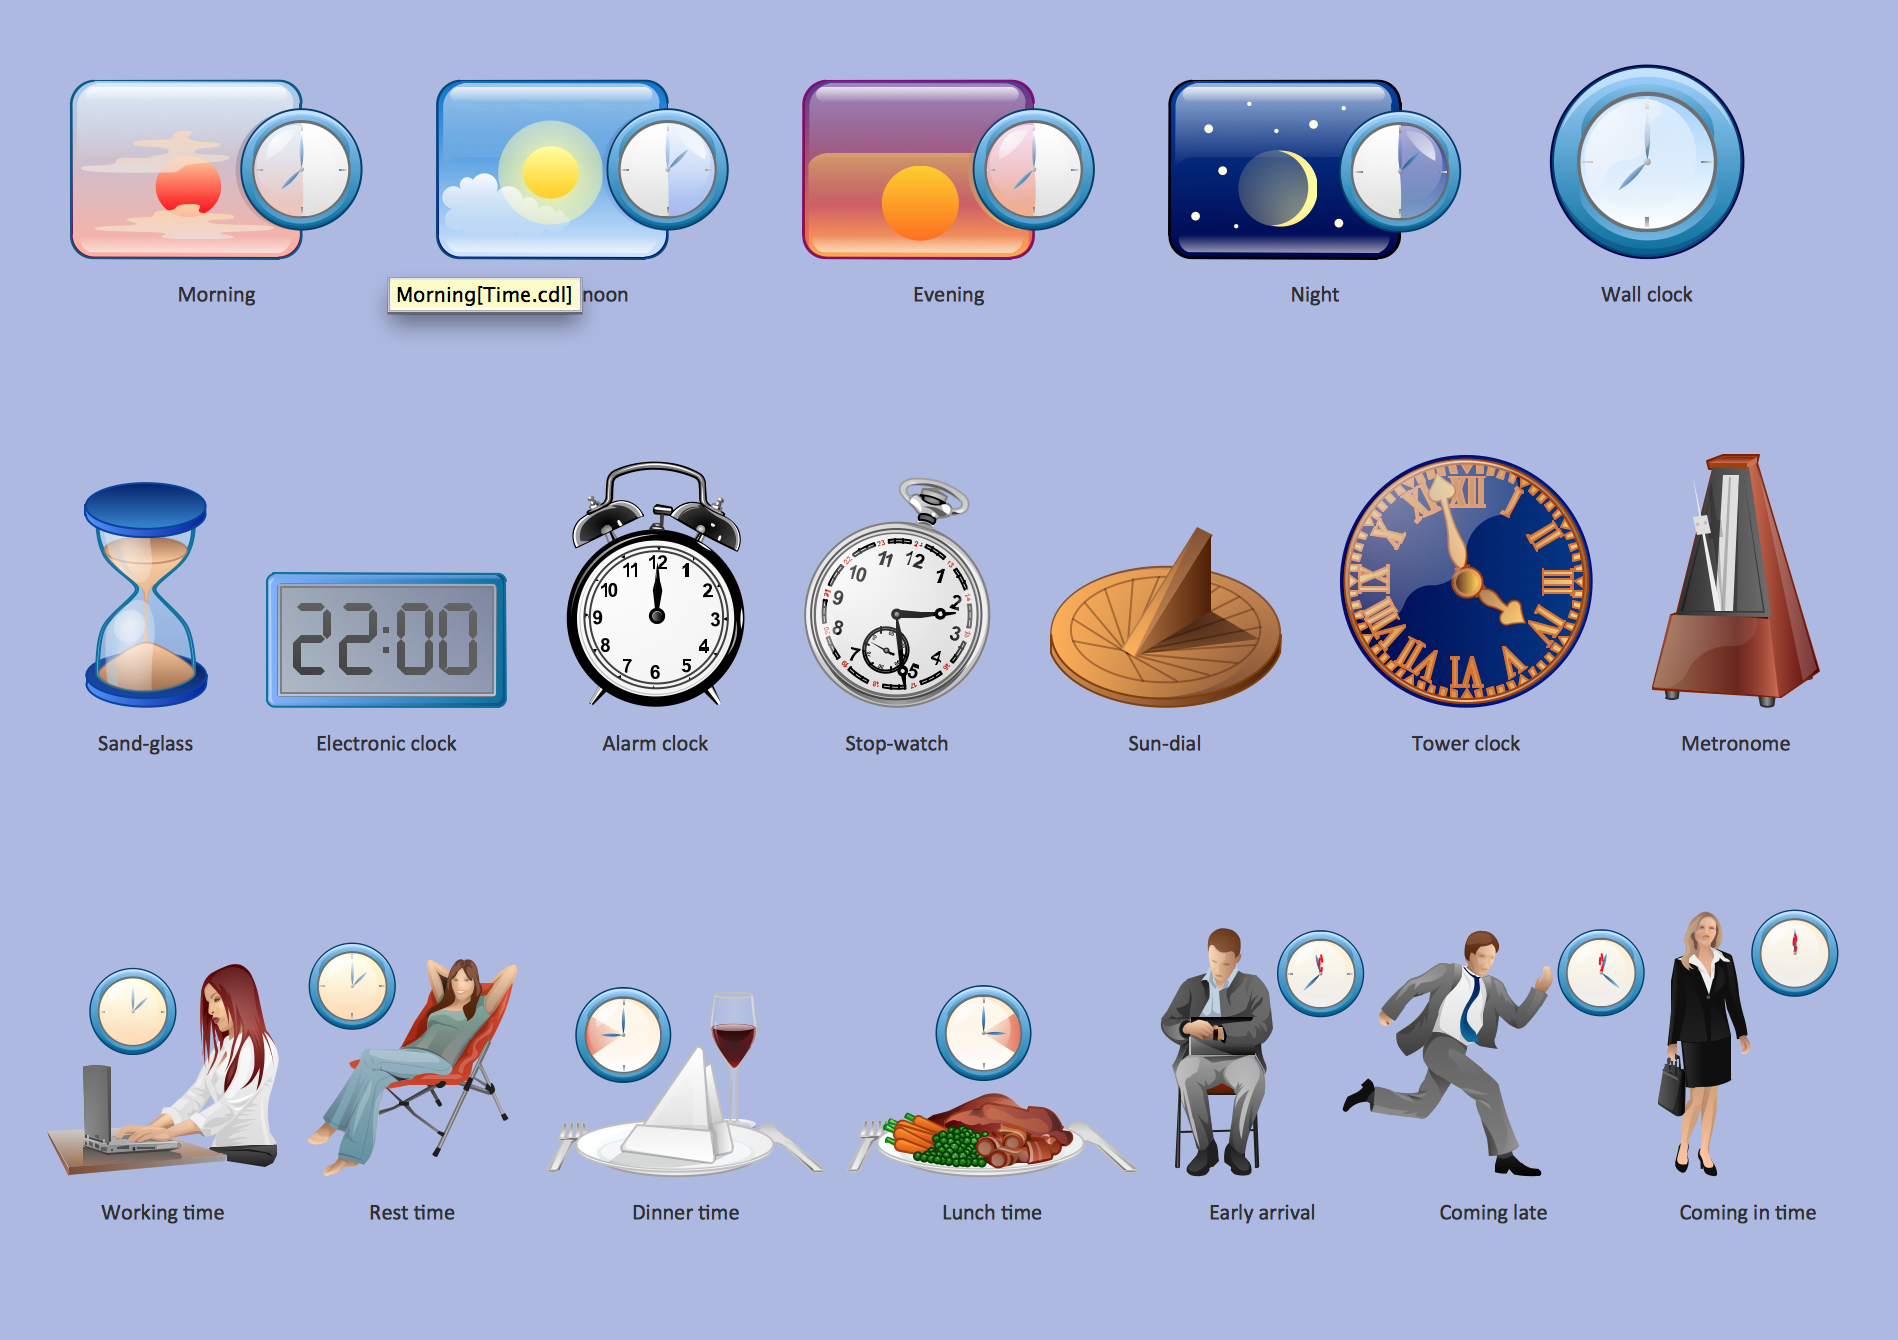
Time - Design Elements
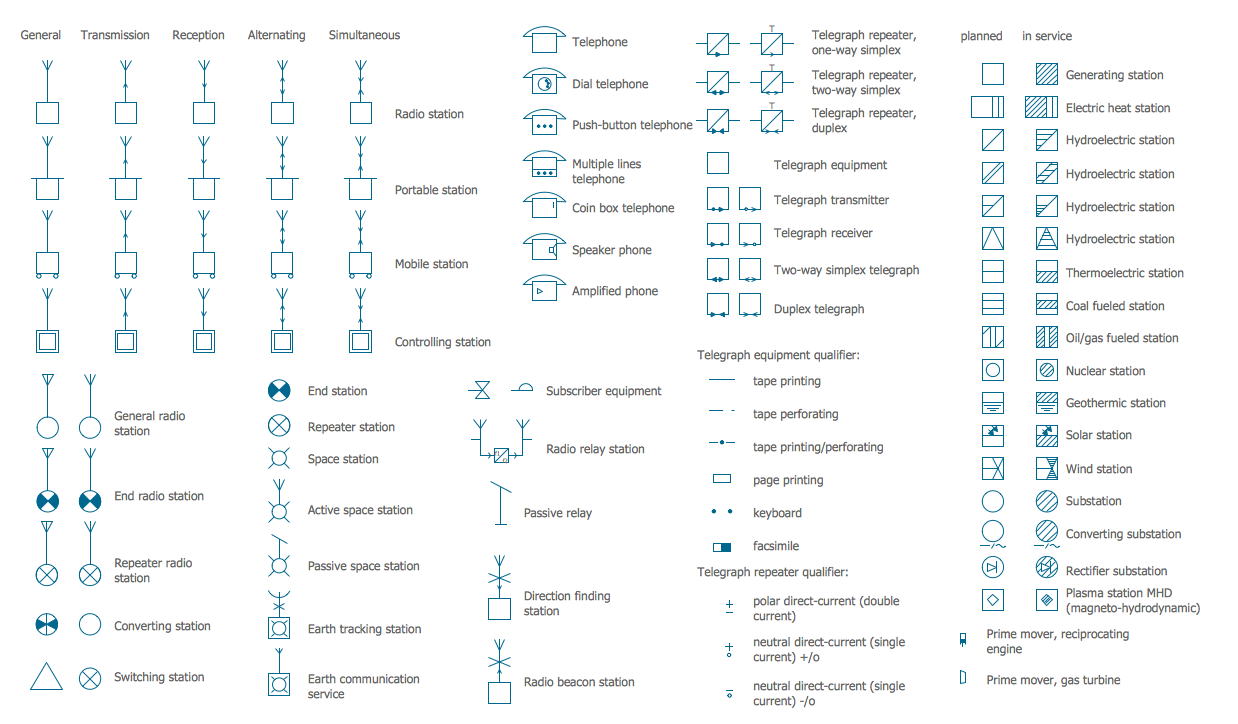
Electrical Symbols — Stations
- EPN Frame-Relay and Dial -up Network. Computer and Network ...
- Network Topologies | EPN Frame-Relay and Dial -up Network ...
- Network Diagram Software Enterprise Private Network | Enterprise ...
- Ios Dial Control
- Time - Design Elements | Wall Clock Tower Dial
- EPN Frame-Relay and Dial -up Network. Computer and Network ...
- Frame relay | EPN Frame-Relay and Dial -up Network. Computer ...
- Using Remote Networking Diagrams | EPN Frame-Relay and Dial ...
- EPN Frame - Relay and Dial -up Network. Computer and Network
- Interior Design Office Layout Plan Design Element | EPN Frame ...
- Example of Organizational Chart | EPN Frame-Relay and Dial -up ...
- Trango - Vector stencils library | EPN Frame-Relay and Dial -up ...
- Hotel Network Topology Diagram | Network Topologies | EPN Frame ...
- Diagarams Of Dial Up And Broadband
- Dial Indicator Dashboard
- Star Network Topology | Network Glossary Definition | EPN Frame ...
- Dial 1
- Dial 2
- KPIs and Metrics | Sales metrics and KPIs - Visual dashboard ...