Star Network Topology


Cisco Network Objects in ConceptDraw DIAGRAM
Activity Network (PERT) Chart

Definition TQM Diagram

BPMN 2.0

HelpDesk
How to Make Network Diagram

 Sales Flowcharts
The Sales Flowcharts solution lets you create and display sales process maps, sales process workflows, sales steps, the sales process, and anything else involving sales process management.
HelpDesk
How to Create a Sales Flowchart

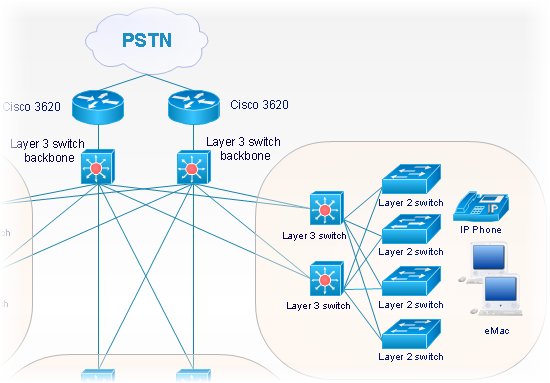
 Computer Network Diagrams
Computer Network Diagrams solution extends ConceptDraw DIAGRAM software with samples, templates and libraries of vector icons and objects of computer network devices and network components to help you create professional-looking Computer Network Diagrams, to plan simple home networks and complex computer network configurations for large buildings, to represent their schemes in a comprehensible graphical view, to document computer networks configurations, to depict the interactions between network's components, the used protocols and topologies, to represent physical and logical network structures, to compare visually different topologies and to depict their combinations, to represent in details the network structure with help of schemes, to study and analyze the network configurations, to communicate effectively to engineers, stakeholders and end-users, to track network working and troubleshoot, if necessary.
IDEF0 standard with ConceptDraw DIAGRAM

 Sales Dashboard
Sales Dashboard solution extends ConceptDraw DIAGRAM software with templates, samples and library of vector stencils for drawing the visual dashboards of sale metrics and key performance indicators (KPI).
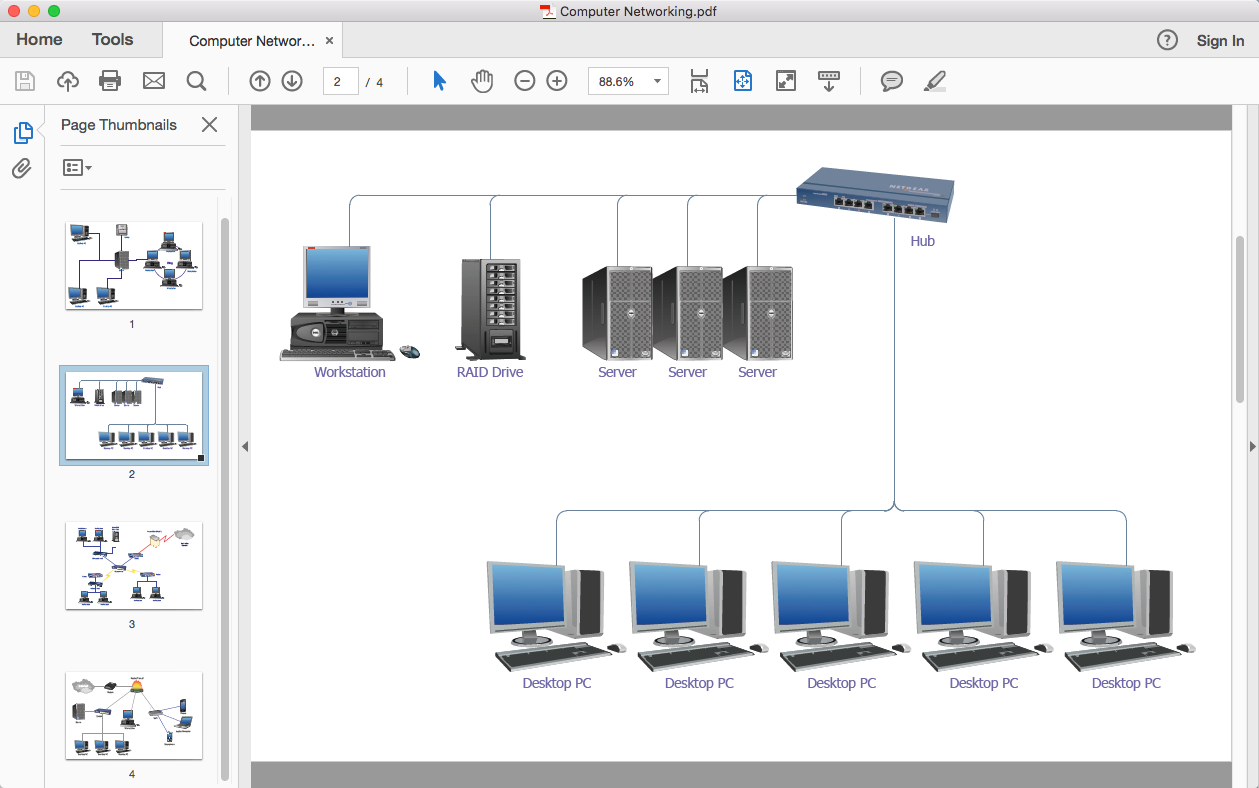
HelpDesk
How To Convert a Computer Network Diagram to Adobe PDF
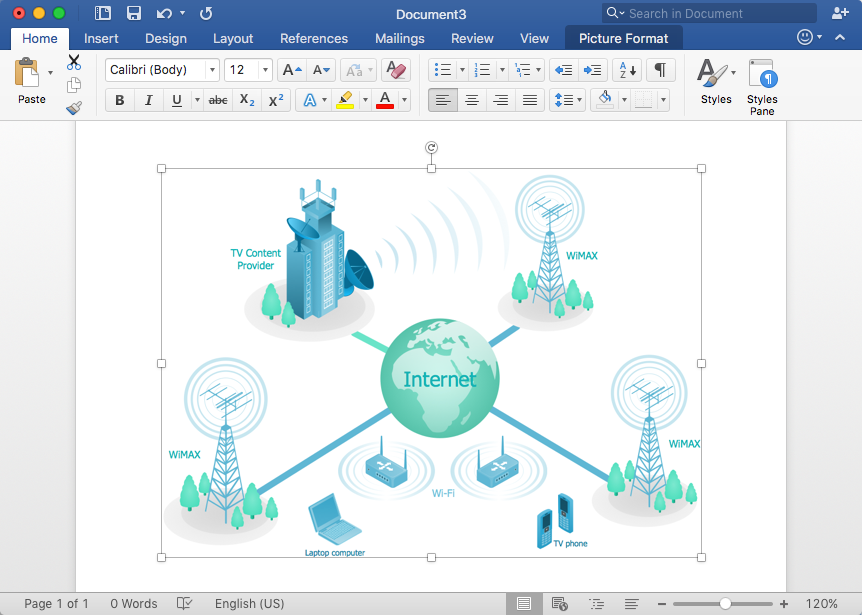
HelpDesk
How to Add a Telecommunication Network Diagram to MS Word
 Cisco Network Diagrams
Cisco Network Diagrams solution extends ConceptDraw DIAGRAM with the best characteristics of network diagramming software. Included samples, templates and libraries of built-in standardized vector Cisco network icons and Cisco symbols of computers, network devices, network appliances and other Cisco network equipment will help network engineers, network designers, network and system administrators, as well as other IT professionals and corporate IT departments to diagram efficiently the network infrastructure, to visualize computer networks topologies, to design Cisco computer networks, and to create professional-looking Cisco Computer network diagrams, Cisco network designs and schematics, Network maps, and Network topology diagrams in minutes.
HelpDesk
How to Create a Telecommunication Network Diagram

- Sales Network Diagram
- Network Diagram Sales
- Flowcharts | Computer Network Diagrams | Sales Flowcharts | 20 ...
- Sales Flowcharts | Cisco Network Diagrams | Fault Tree Analysis ...
- Sales Flowcharts | Data Flow Diagrams (DFD) | Network Diagram ...
- Activity Network Diagram Method | Pie Chart Examples and ...
- How to Add a Telecommunication Network Diagram to a PowerPoint ...
- Telecommunication Network Diagrams | Sales Process Flowchart ...
- How to Draw a Computer Network Diagrams | Sales Process ...
- Communication network diagram | Fully Connected Network ...
- Business diagrams & Org Charts with ConceptDraw PRO ...
- Activity Network Diagram Method | Basic Flowchart Symbols and ...
- Event-driven Process Chain Diagrams | Sales Flowcharts ...
- Sales Workflow Diagram For Training Centre
- Process Flowchart | Network diagrams with ConceptDraw PRO ...
- Computer Network Diagrams | Scope Functions Of Sales ...
- Office Layout Plans | Cisco Network Diagrams | Sales Flowcharts ...
- Traffic Accident Diagrams
- Interactive Voice Response Network Diagram | Network ...