Activity Network (PERT) Chart

Sales Process Steps

Activity Network Diagram Method

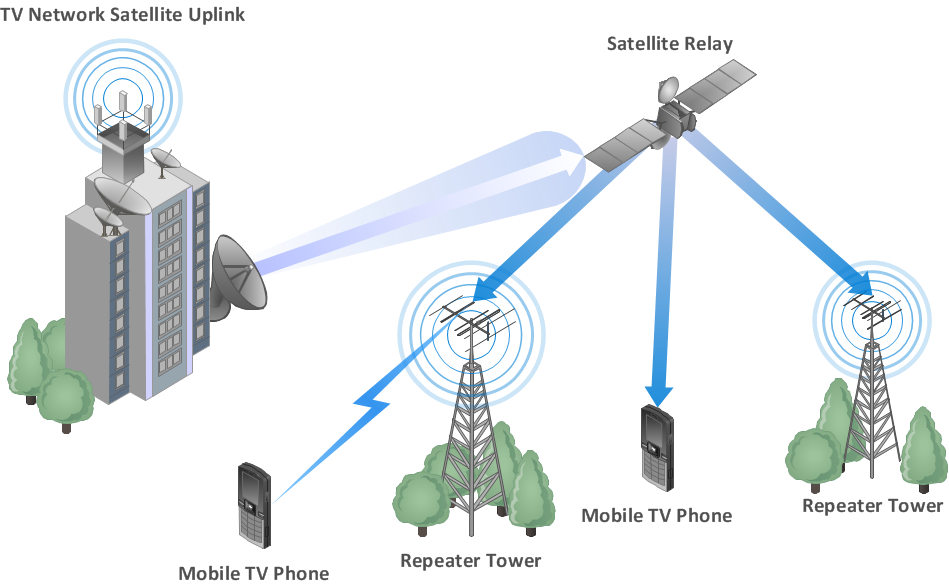
Wireless Network WAN
Root Cause Analysis


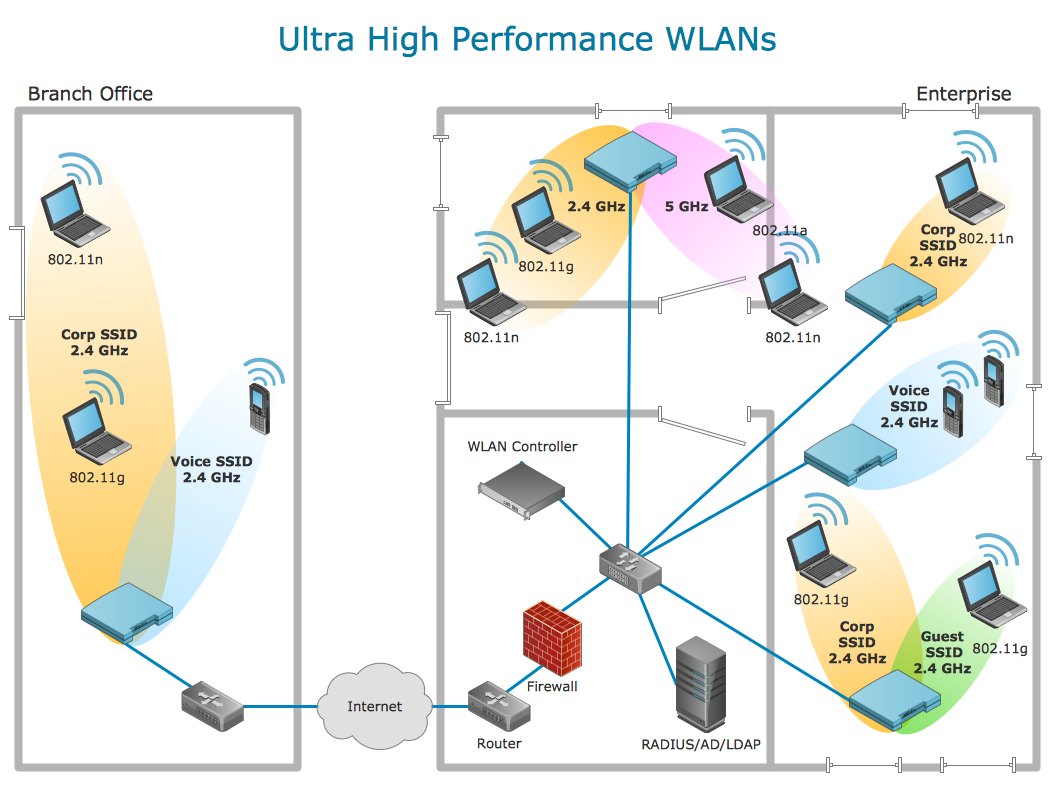
Using Remote Networking Diagrams

Sales Process Management

It is effective to use professional software for the sales process management. ConceptDraw DIAGRAM diagramming and vector drawing software extended with Sales Flowcharts solution from the Marketing area of ConceptDraw Solution Park is the best choice.
 Sales Flowcharts
The Sales Flowcharts solution lets you create and display sales process maps, sales process workflows, sales steps, the sales process, and anything else involving sales process management.
 Sales Dashboard
Sales Dashboard solution extends ConceptDraw DIAGRAM software with templates, samples and library of vector stencils for drawing the visual dashboards of sale metrics and key performance indicators (KPI).
Sales Growth. Bar Graphs Example

- Network Diagram Software Backbone Network | Sales Flowcharts ...
- Established Sales Network Diagram
- Diagrams | Time Sales Network Diagram
- Sales Flowcharts | How to Create a Telecommunication Network ...
- SWOT and TOWS Matrix Diagrams | Telecommunication Network ...
- Hotel reservation system | Network Diagramming Software for ...
- Computer Network Diagrams | Sales Process | Chemistry Equation ...
- Sales Flowcharts | ConceptDraw Arrows10 Technology | Draw ...
- Cross-Functional Flowcharts | Process Flowcharts | Sales ...
- Basic Network Diagram | Simple Flow Chart Of Hotel Management