Pyramid Diagram

"The Time/ Money/ Quality Triangle illustrates an advertising truism, that "you can't have all three." If there is little time or money, then ad quality will suffer. The more time and/ or money that is available to the project, the higher the quality can be. However, the level of quality must be appropriate to the product...not all products should have high-quality ads!" [Advertising/ Strategies. Wikibooks]
This triangular diagram example was redesigned using the ConceptDraw PRO diagramming and vector drawing software from Wikimedia Commons file Time-Quality-Money.png. [commons.wikimedia.org/ wiki/ File:Time-Quality-Money.png]
This file is licensed under the Creative Commons Attribution-Share Alike 3.0 Unported license. [creativecommons.org/ licenses/ by-sa/ 3.0/ deed.en]
The chart sample "Time, quality, money triangle diagram" is included in the Pyramid Diagrams solution from the Marketing area of ConceptDraw Solution Park.
Triangular chart

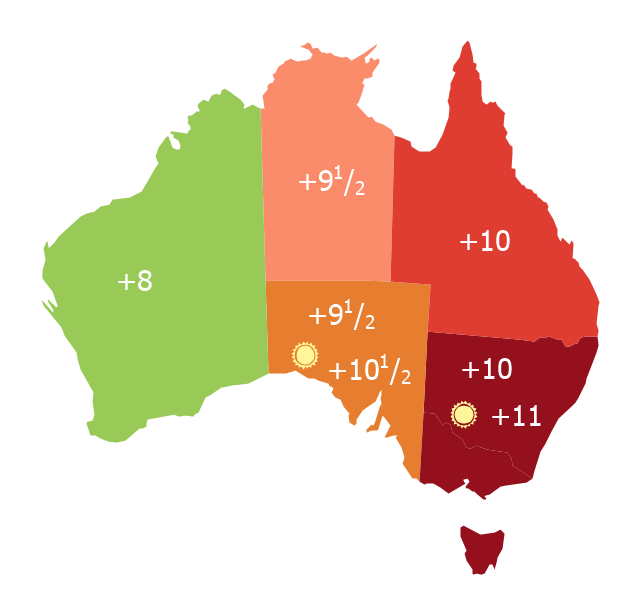
Map of Australia depicting time zones offsets from UTC by state (including daylight saving).
"Time in Australia uses more than three time zones, including Australian Western Standard Time (AWST; UTC+08:00), Australian Central Standard Time (ACST; UTC+09:30), and Australian Eastern Standard Time (AEST; UTC+10:00). Time is regulated by the individual state governments, some of which observe daylight saving time (DST). Australia's external territories observe different time zones." [Time in Australia. Wikipedia]
This thematic map was redesigned from Wikipedia file: Australia states timezones.png. [commons.wikimedia.org/ wiki/ File:Australia-states-timezones.png]
This file is licensed under the Creative Commons Attribution-Share Alike 3.0 Unported license.
[creativecommons.org/ licenses/ by-sa/ 3.0/ deed.en]
The thematic map example "Australia states time zones" was created using the ConceptDraw PRO diagramming and vector drawing software extended with the Continent Maps solution from the Maps area of ConceptDraw Solution Park.
Thematic map - Australia states time zones
Examples of Flowcharts, Org Charts and More


This picture bar graph sample shows the computer and Internet use at home from 1984 to 2014. It was designed using data from website of the United States Census Bureau (USCB).
[census.gov/ content/ dam/ Census/ library/ visualizations/ 2016/ comm/ digital_ nation.png]
"Home automation is the residential extension of building automation and involves the control and automation of lighting, heating, ventilation, air conditioning (HVAC), appliances, and security. Modern systems generally consist of switches and sensors connected to a central hub sometimes called a "gateway" from which the system is controlled with a user interface that is interacted either with a wall-mounted terminal, mobile phone software, tablet computer or a web interface." [Home automation. Wikipedia]
The pictorial chart example "Computer and Internet use at home over time" was created using the ConceptDraw PRO diagramming and vector drawing software extended with the Picture Graphs solution from the Graphs and Charts area of ConceptDraw Solution Park.
Image chart

This interactive voice response (IVR) diagram sample shows the Scheme of VoIP call with SIM box and gateway. It was designed on the base of the Wikimedia Commons file: Scheme of VoIP call with Sim box.png. [commons.wikimedia.org/ wiki/ File:Scheme_ of_ VoIP_ call_ with_ Sim_ box.png]
This file is licensed under the Creative Commons Attribution-Share Alike 4.0 International license. [creativecommons.org/ licenses/ by-sa/ 4.0/ deed.en]
"A SIM box (also called a SIM bank) is device used as part of a VoIP gateway installation. It contains a number of SIM cards, which are linked to the gateway but housed and stored separately from it. A SIM box can have SIM cards of different mobile operators installed, permitting it to operate with several GSM gateways located in different places." [SIM box. Wikipedia]
The IVR diagram example "VoIP call with SIM box and gateway" was designed using ConceptDraw PRO diagramming and vector drawing software extended with the Interactive Voice Response Diagrams solution from the Computer and Networks area of ConceptDraw Solution Park.
IVR diagram

Pyramid Diagram

Process Flowchart


This cycle process chart was redesigned from the Wikimedia Commons file: Business Feedback Loop PNG version.png.
"A business ideally is continually seeking feedback from customers: are the products helpful? are their needs being met? Constructive criticism helps marketers adjust offerings to meet customer needs."
[commons.wikimedia.org/ wiki/ File:Business_ Feedback_ Loop_ PNG_ version.png]
The cycle process diagram example "Business feedback loop" was created using the ConceptDraw PRO diagramming and vector drawing software extended with the Sales Flowcharts solution from the Marketing area of ConceptDraw Solution Park.
Customers feedback cycle process chart

Gant Chart in Project Management


Pyramid Diagram

Pyramid Diagram

Chart Examples

- Time Vector Png High Quality
- Png Time
- Pyramid Diagram | Time , quality, money triangle diagram | Money ...
- Export from ConceptDraw PRO Document to a Graphic File | Time ...
- Time Vector Png
- Time - Vector stencils library | Road signs - Vector stencils library ...
- Working Waiting Time Png Icon
- Time Symbols Png
- Time and clock pictograms - Vector stencils library | Design ...
- Time and clock pictograms - Vector stencils library | Time and clock ...
- Time and clock pictograms - Vector stencils library | Time and clock ...
- Time and clock pictograms - Vector stencils library | Time and clock ...
- Time , quality, money triangle diagram | Pyramid Diagram | Pyramid ...
- Triangle Png
- Half Circle Png
- Clip Art Half Circle Hd Image Png
- Finance Clipart Png
- Png Series
- Triangle chart - Template | Pyramid Diagram | Time , quality, money ...
- Holiday Recipes | Dinner Recipes | Food Recipes | Spoon Vector Png