Quality visualization in your company
Using ConceptDraw quality mind maps is a perfect addition to quality visualization in your company.
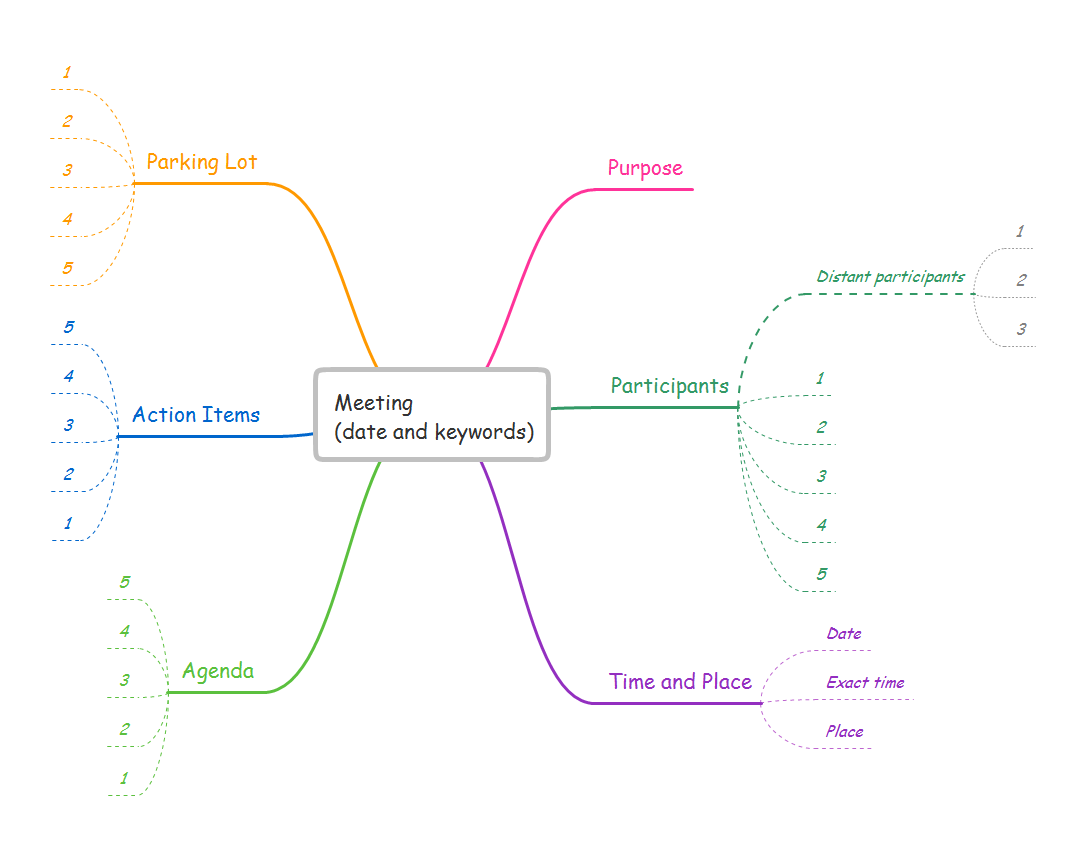
A Tool for EffectiveTeam Meetings
Use team meetings, share ideas, brainstorm ideas, team notes with ConceptDraw solution.
Presenting a Slide Show to a Group of People
Tips on how to present a slide show to a group. Deliver a successful presentation to your team.
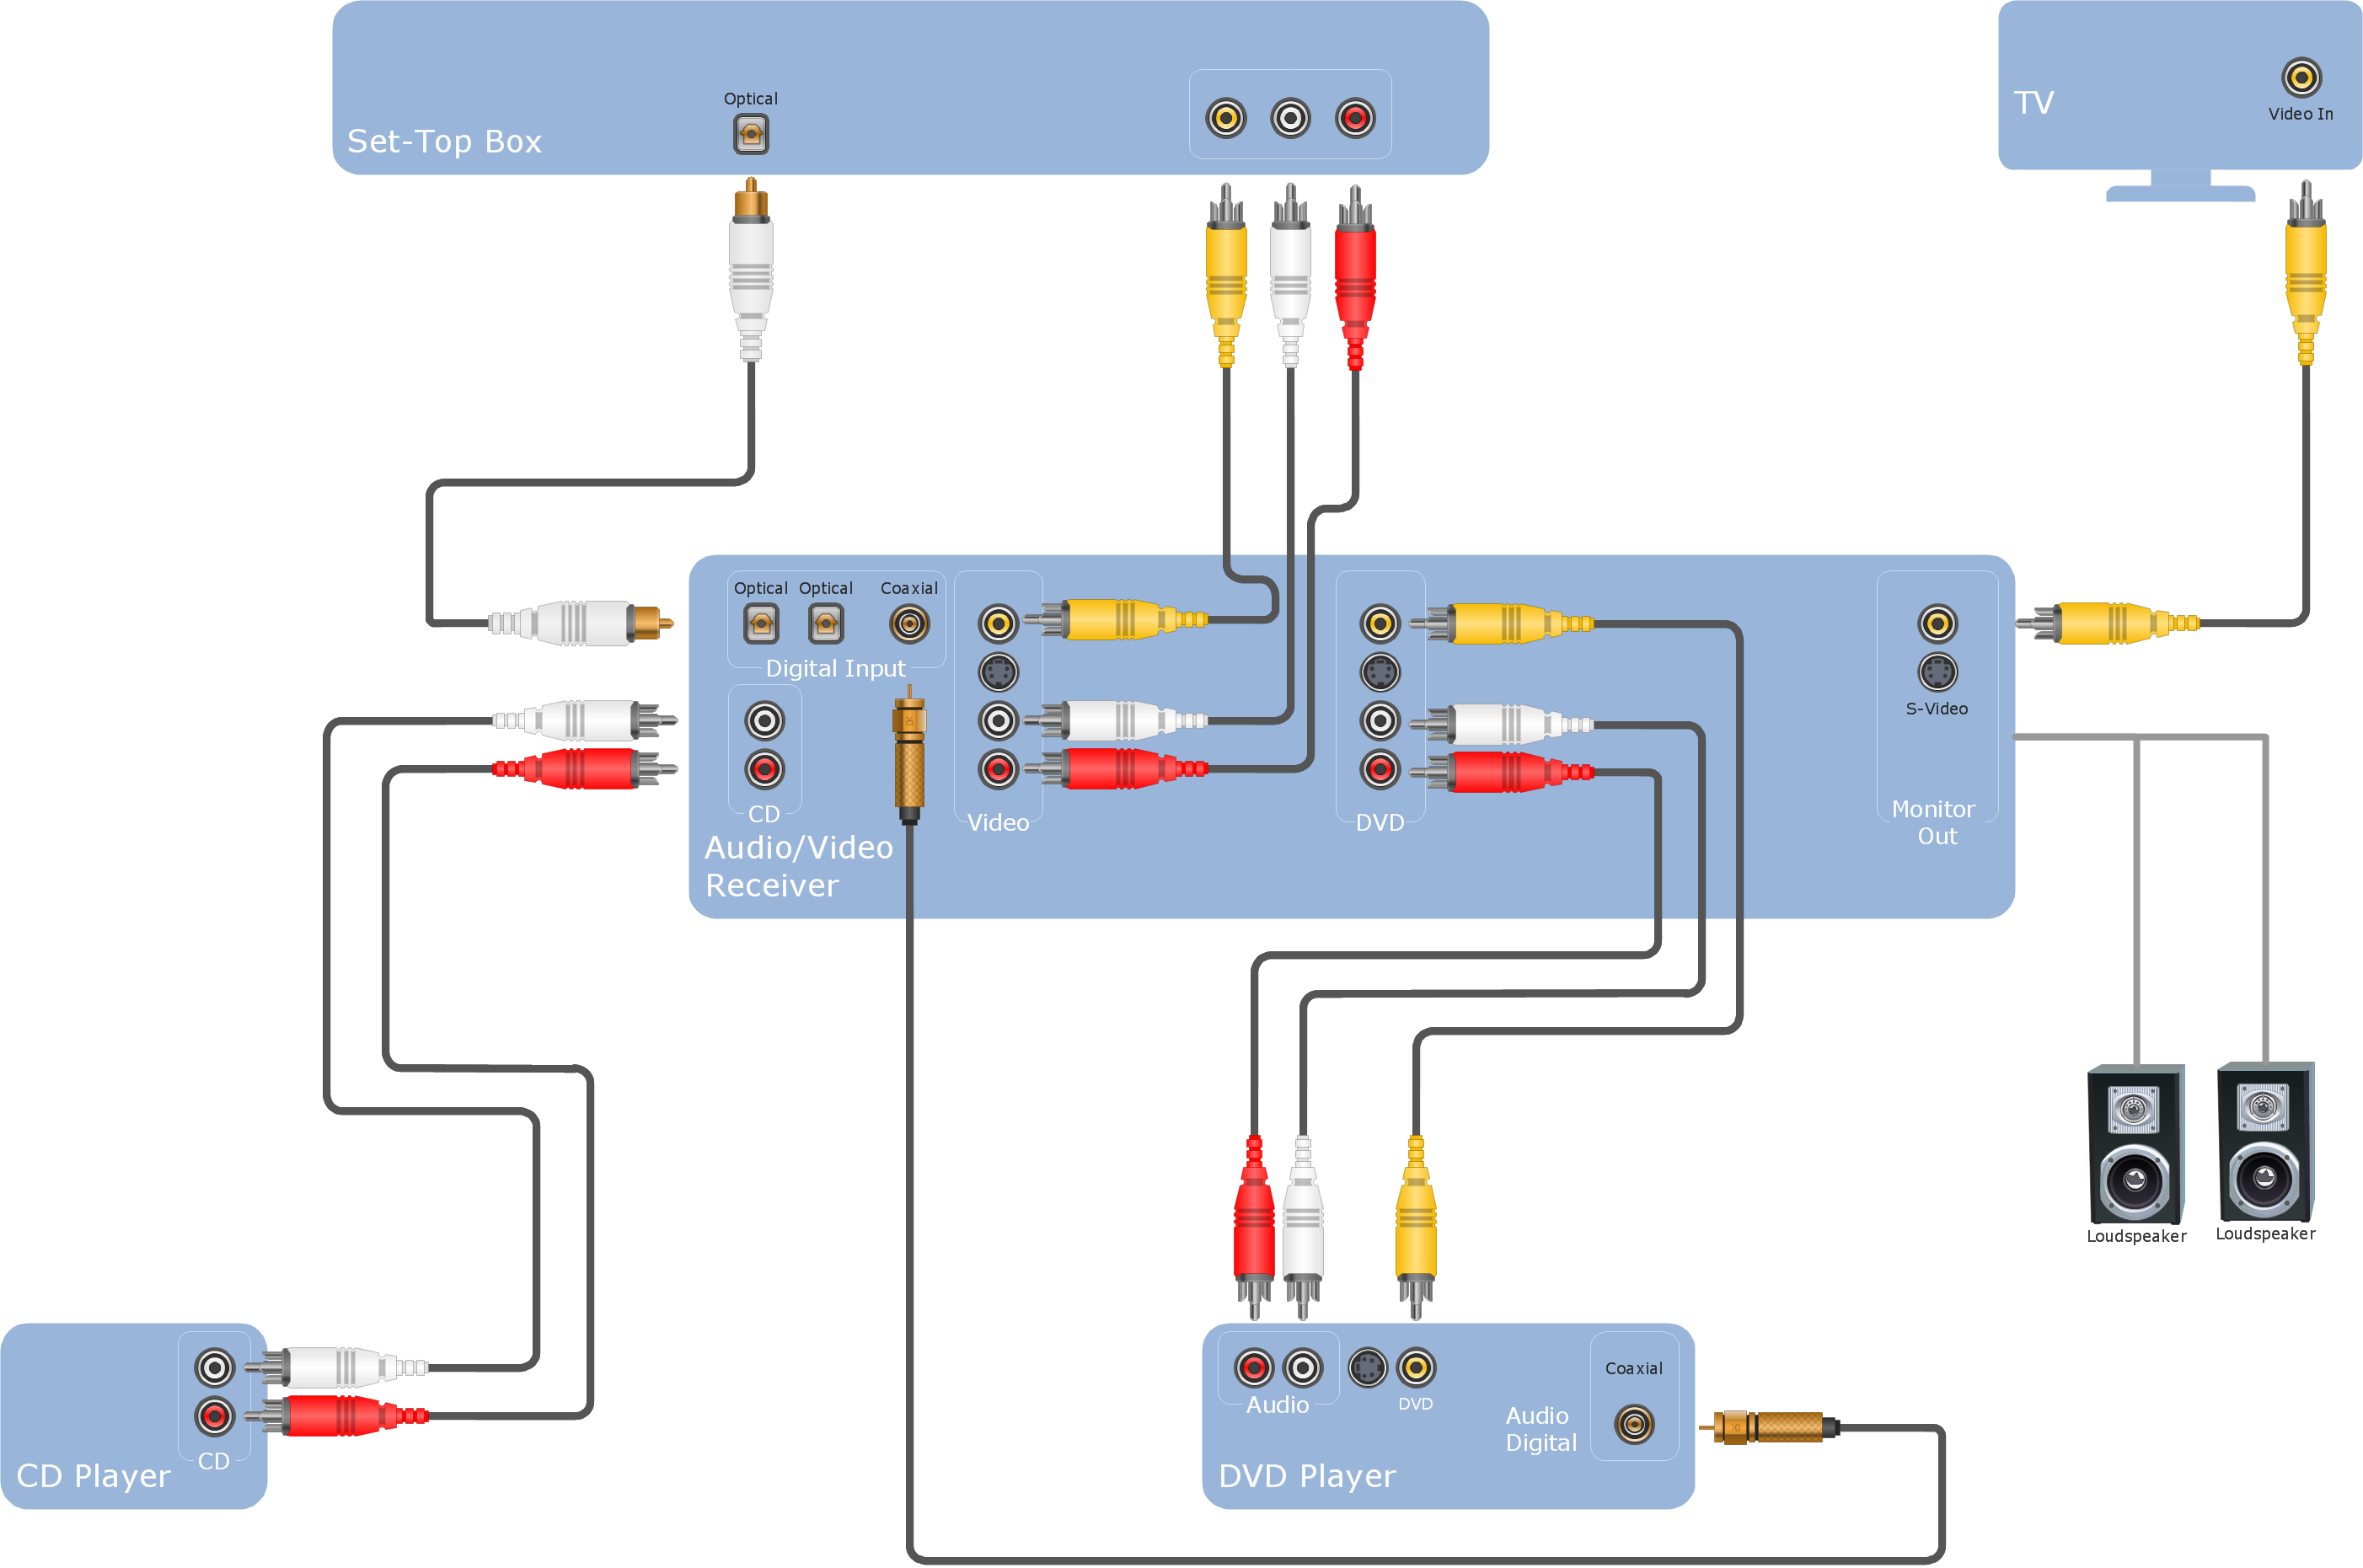
Local area network (LAN). Computer and Network Examples
A local area network (LAN) is a devices network that connect with each other in the scope of a home, school, laboratory, or office. Usually, a LAN comprise computers and peripheral devices linked to a local domain server. All network appliances can use a shared printers or disk storage. A local area network serve for many hundreds of users. Typically, LAN includes many wires and cables that demand a previously designed network diagram. They are used by IT professionals to visually document the LANs physical structure and arrangement.ConceptDraw - Perfect Network Diagramming Software with examples of LAN Diagrams. ConceptDraw Network Diagram is ideal for network engineers and network designers who need to draw Local Area Network diagrams.

ConceptDraw Arrows10 Technology
You can see that when you rotate a group, connectors change their angle, keeping their position inside of the grouped objects. If you decide to ungroup the objects, the connectors will adjust to keep lines parallel to the edges of the sheet.The magic of ConceptDraw Arrows10’s rotating group containing connectors, makes complex diagramming simple and easy.
The way to connect objects has never been easier.
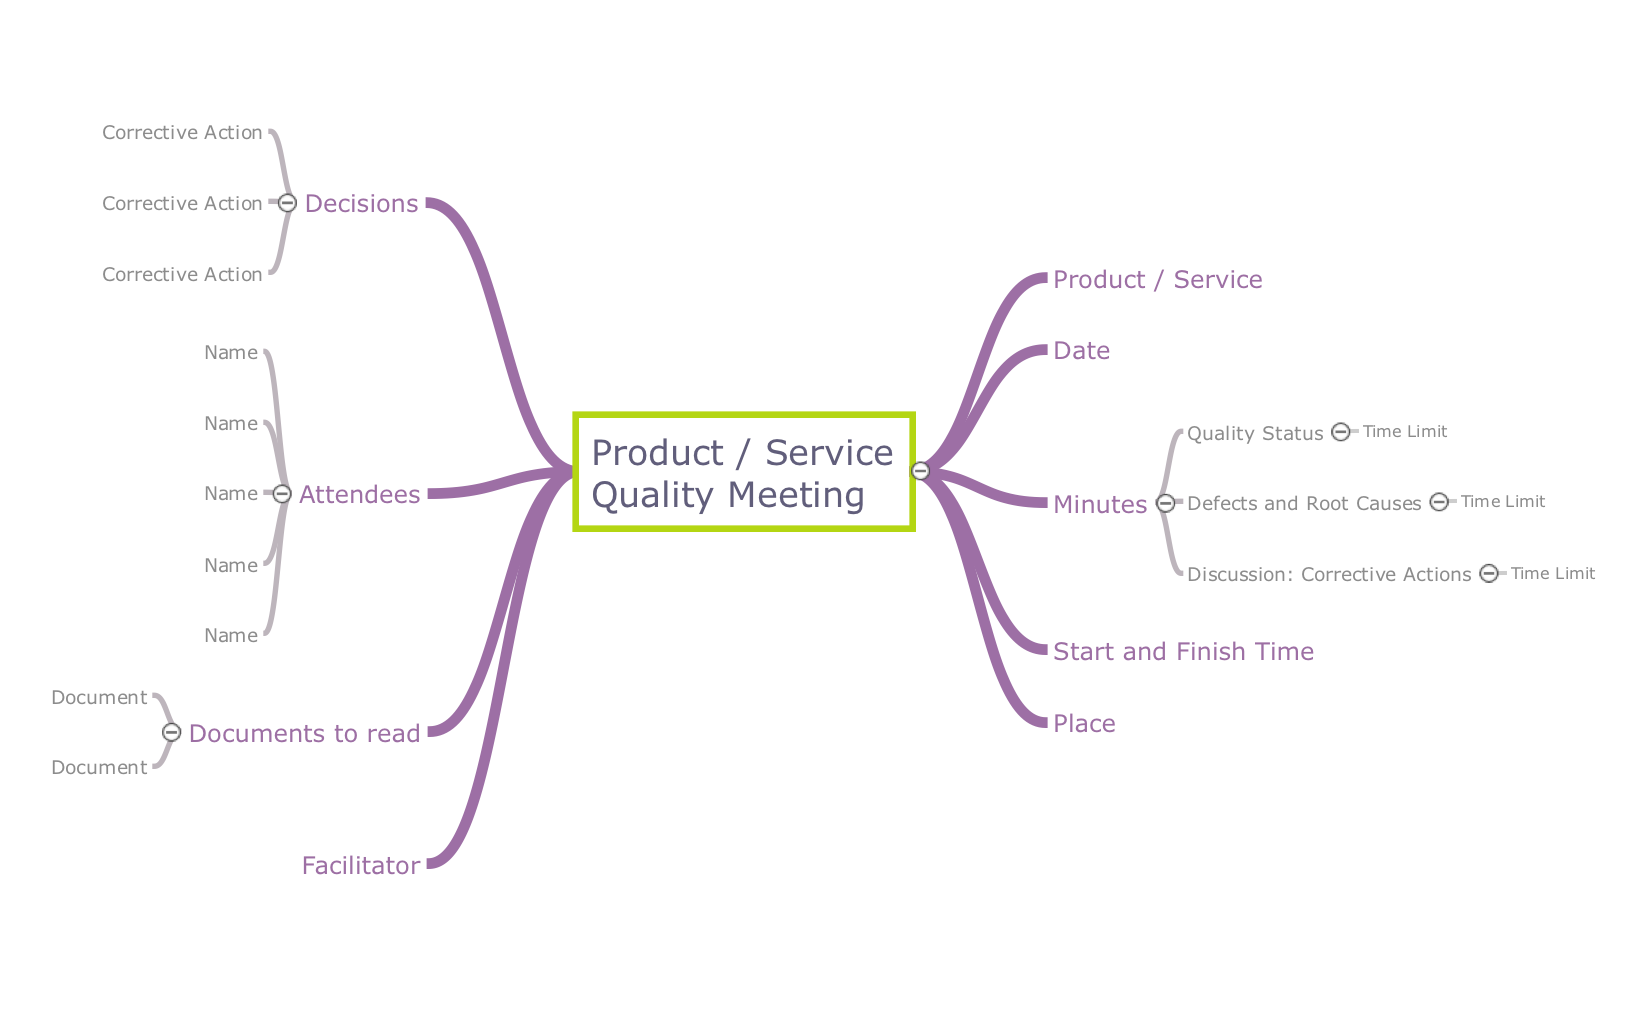
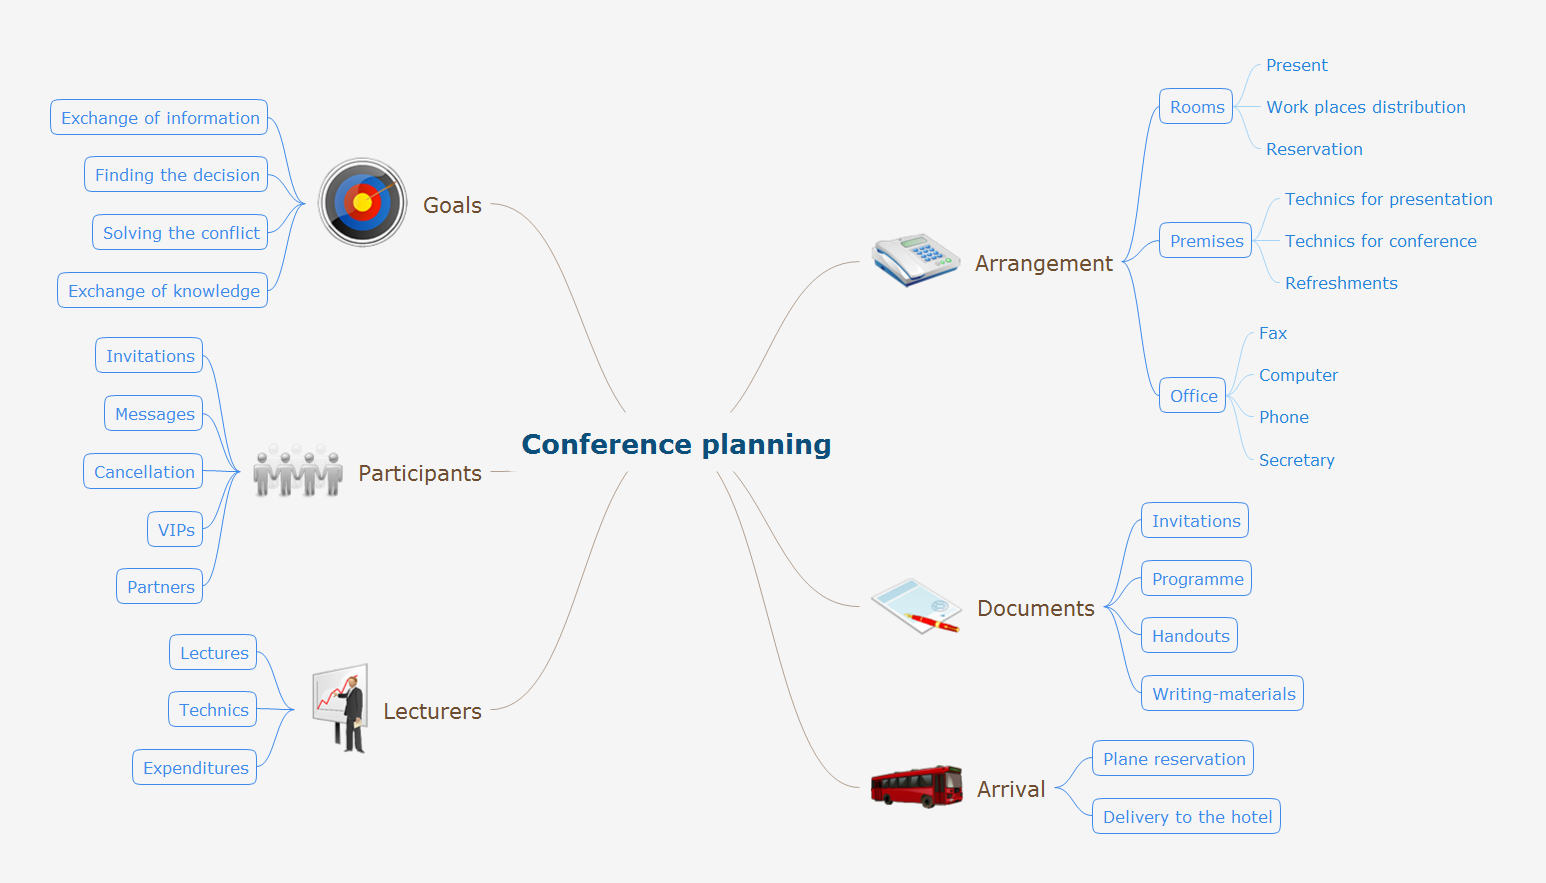
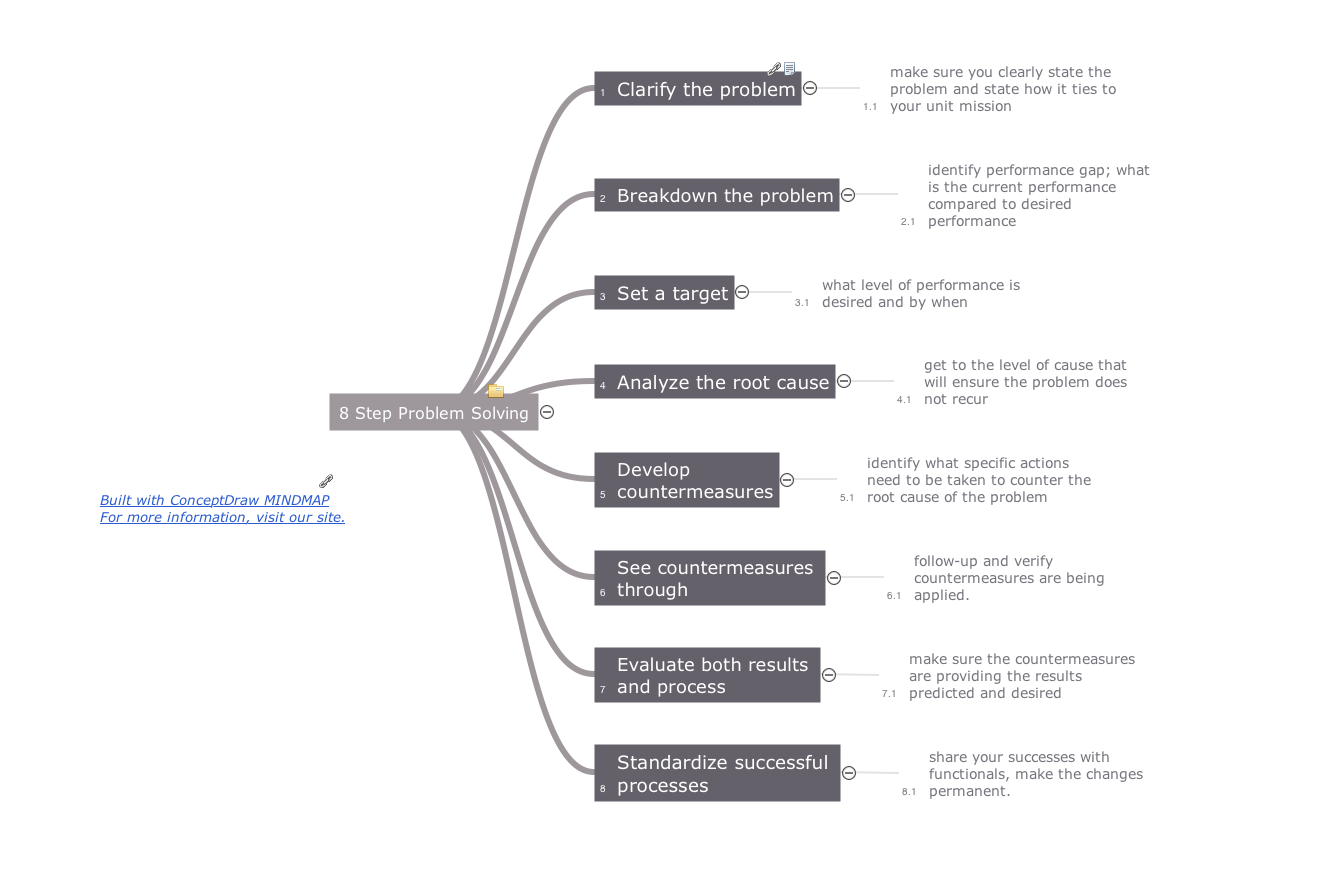
Quality Management Teams
ConceptDraw MINDMAP with Quality mindmaps solution as a demonstration of the creative approach to quality management in daily work of quality management team.How to show a mind map presentation via Skype
Video tutorials on ConceptDraw products. Try it today!Root Cause Tree Diagram
Analyze the root causes of factors that influence the problem. A diagram is constructed separately for each high priority factor. Identify the root causes for a factor and then propose possible corrective actions. The diagram displays the structure of causes for a factor and possible corrective actions. The Root Cause Analysis Tree Diagram is used for further formulation of actions.Group Collaboration Software
A software for group collaboration helps to facilitate action-oriented teams working together over geographic distances by providing tools that aid communication.
HelpDesk
How To Create an Affinity Diagram Using Solutions
The affinity diagram is designed to prepare the data for further analysis of the cause-effect relationships. The Affinity diagram shows the structure of large, complex factors that have an influence on a problem, and then divides them up into a smaller and simpler structure. We recommend using a mind map for Brainstorming and collecting the factors affecting the problem. The ability to create an Affinity diagram from a mind map is supported by the ConceptDraw Seven Management and Planning Tools solution.- Quality Mind Map | TQM Diagram Example | Group Collaboration ...
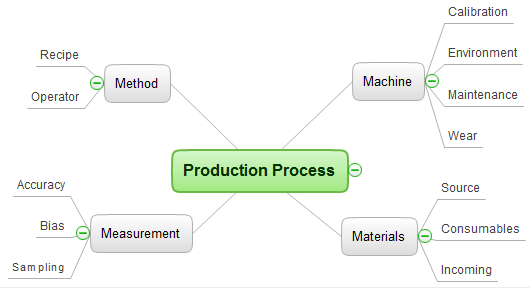
- Mind Map For A Production Process
- Mind Map For Group 7
- Company Meeting Diagram
- Azure Architecture | UK Map | Concept Maps | System Context ...
- Meeting Agenda Map | How To Successfully Hold a Group Meeting ...
- Decision Making | Quality Criteria MindMap | Quality Management ...
- Definition TQM Diagram | Group Collaboration Software ...
- ConceptDraw eLearning for Skype - Powerful eLearning Tool
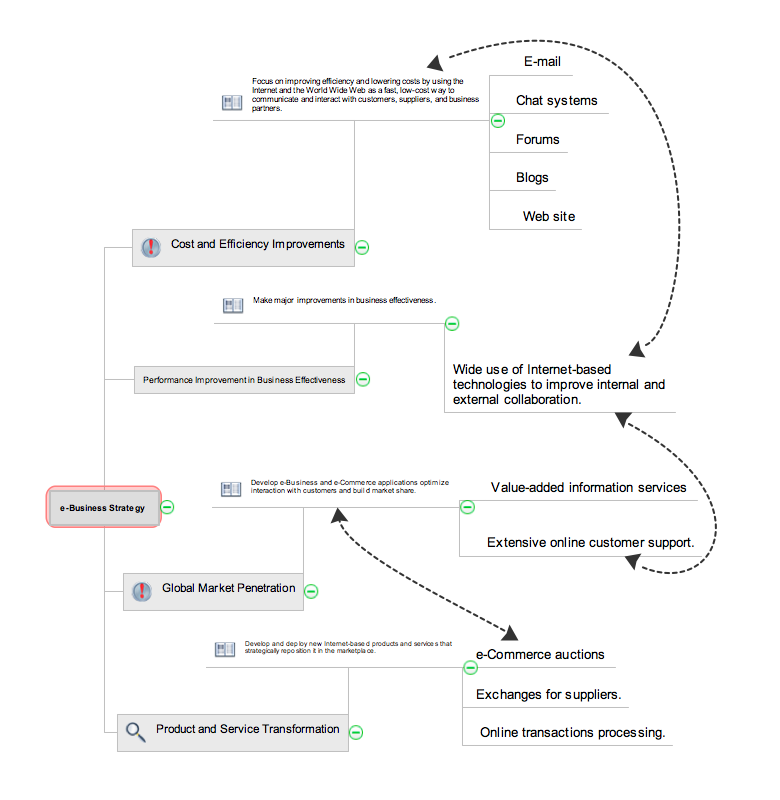
- Internet marketing - Concept map | Design elements - Marketing ...
- ERD | Entity Relationship Diagrams, ERD Software for Mac and Win
- Flowchart | Basic Flowchart Symbols and Meaning
- Flowchart | Flowchart Design - Symbols, Shapes, Stencils and Icons
- Flowchart | Flow Chart Symbols
- Electrical | Electrical Drawing - Wiring and Circuits Schematics
- Flowchart | Common Flowchart Symbols