SWOT Analysis

 25 Typical Orgcharts
The 25 Typical Orgcharts solution contains powerful organizational structure and organizational management drawing tools, a variety of professionally designed organization chart and matrix organization structure samples, 25 templates based on various orga
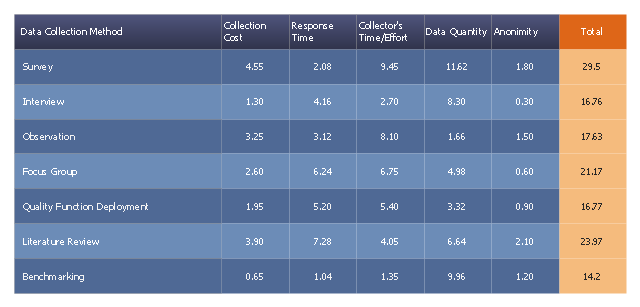
"Data collection is the process of gathering and measuring information on variables of interest, in an established systematic fashion that enables one to answer stated research questions, test hypotheses, and evaluate outcomes. The data collection component of research is common to all fields of study including physical and social sciences, humanities, business, etc. While methods vary by discipline, the emphasis on ensuring accurate and honest collection remains the same.
Regardless of the field of study or preference for defining data (quantitative, qualitative), accurate data collection is essential to maintaining the integrity of research. Both the selection of appropriate data collection instruments (existing, modified, or newly developed) and clearly delineated instructions for their correct use reduce the likelihood of errors occurring." [Data collection. Wikipedia]
This prioritization matrix example was created using the ConceptDraw PRO diagramming and vector drawing software extended with the solution "Seven Management and Planning Tools" from the Management area of ConceptDraw Solution Park.
Prioritization matrix
Basic Flowchart Symbols and Meaning


Competitor Analysis

ConceptDraw MINDMAP: Brainstorming, Mind Mapping for macOS and Windows

 Entity-Relationship Diagram (ERD)
Entity-Relationship Diagram (ERD) solution extends ConceptDraw PRO software with templates, samples and libraries of vector stencils from drawing the ER-diagrams by Chen's and crow’s foot notations.
Model Based Systems Engineering

Basketball Defense Drills

 Food Court
Use the Food Court solution to create food art. Pictures of food can be designed using libraries of food images, fruit art and pictures of vegetables.
Organization Chart Templates

 Area Charts
Area Charts are used to display the cumulative totals over time using numbers or percentages; or to show trends over time among related attributes. The Area Chart is effective when comparing two or more quantities. Each series of data is typically represented with a different color, the use of color transparency in an object’s transparency shows overlapped areas and smaller areas hidden behind larger areas.
 Business Process Mapping
The Business Process Mapping solution for ConceptDraw PRO is for users involved in process mapping and creating SIPOC diagrams.
- Examples Of Products In Boston Matrix
- PROBLEM ANALYSIS. Prioritization Matrix | How To Create a ...
- Prioritization Matrix Example
- SWOT and TOWS Matrix Diagrams | How to Make SWOT Analysis in ...
- Example Of Office Prioritisation Test
- Prioritization matrix - Data collection | Prioritization matrix - Data ...
- Camera layout schematic | How To Create CCTV Network Diagram ...
- Chart Examples | Line Chart Examples | Chart Templates ...
- Basic Diagramming | Venn diagrams with ConceptDraw PRO | Line ...
- https://www.conceptdraw.com/ examples /uuo-element daily 0.56 http ...
- Test Case Diagram Of Online Electricity Bill Payment
- Quality function deployment chart - Handheld projector | Quality ...
- Business Productivity - Marketing | Helpful in all stages of quality ...
- Quality function deployment chart - Template | Matrices ...
- Seven Management and Planning Tools | Prioritization matrix - Data ...
- Decision tree diagram | Types of Flowcharts | Prioritization Matrix ...
- Step chart - Template | Process Flowchart | Flow chart Example ...
- Draw Test Case Diagram For Online Electricity Bill Payment
- Create A Test Case Diagram For Online Bill Payment
- Deployment Chart Software | Deployment chart - Template | Trading ...