"Data collection is the process of gathering and measuring information on variables of interest, in an established systematic fashion that enables one to answer stated research questions, test hypotheses, and evaluate outcomes. The data collection component of research is common to all fields of study including physical and social sciences, humanities, business, etc. While methods vary by discipline, the emphasis on ensuring accurate and honest collection remains the same.
Regardless of the field of study or preference for defining data (quantitative, qualitative), accurate data collection is essential to maintaining the integrity of research. Both the selection of appropriate data collection instruments (existing, modified, or newly developed) and clearly delineated instructions for their correct use reduce the likelihood of errors occurring." [Data collection. Wikipedia]
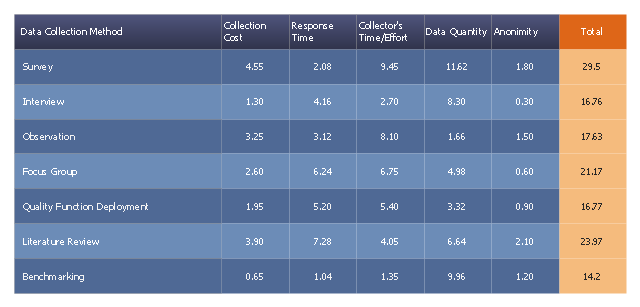
This prioritization matrix example was created using the ConceptDraw PRO diagramming and vector drawing software extended with the solution "Seven Management and Planning Tools" from the Management area of ConceptDraw Solution Park.
Regardless of the field of study or preference for defining data (quantitative, qualitative), accurate data collection is essential to maintaining the integrity of research. Both the selection of appropriate data collection instruments (existing, modified, or newly developed) and clearly delineated instructions for their correct use reduce the likelihood of errors occurring." [Data collection. Wikipedia]
This prioritization matrix example was created using the ConceptDraw PRO diagramming and vector drawing software extended with the solution "Seven Management and Planning Tools" from the Management area of ConceptDraw Solution Park.
Prioritization matrix
"Data collection is the process of gathering and measuring information on variables of interest, in an established systematic fashion that enables one to answer stated research questions, test hypotheses, and evaluate outcomes. The data collection component of research is common to all fields of study including physical and social sciences, humanities, business, etc. While methods vary by discipline, the emphasis on ensuring accurate and honest collection remains the same.
Regardless of the field of study or preference for defining data (quantitative, qualitative), accurate data collection is essential to maintaining the integrity of research. Both the selection of appropriate data collection instruments (existing, modified, or newly developed) and clearly delineated instructions for their correct use reduce the likelihood of errors occurring." [Data collection. Wikipedia]
This prioritization matrix example was created using the ConceptDraw PRO diagramming and vector drawing software extended with the solution "Seven Management and Planning Tools" from the Management area of ConceptDraw Solution Park.
Prioritization matrix
 ConceptDraw Solution Park
ConceptDraw Solution Park collects graphic extensions, examples and learning materials
HelpDesk
How to Use ConceptDraw Sales Dashboard Solution

Data modeling with ConceptDraw DIAGRAM

Data Flow Diagram Examples

ConceptDraw Solution Park
ConceptDraw Solution Park collects graphic extensions, examples and learning materials
HelpDesk
How to Create a Time Series Dashboard

HelpDesk
How to Create a Sales Dashboard

Chart Software for Better Presentations

Account Flowchart Stockbridge System. Flowchart Examples

ConceptDraw Solution Park
ConceptDraw Solution Park collects graphic extensions, examples and learning materials
HelpDesk
How to Create a Data Flow Diagram

IDEF9 Standard

- Data Input Collection - Conceptdraw.com
- Data Output Collection - Conceptdraw.com
- Prioritization matrix - Data collection
- Data - Vector stencils library - Conceptdraw.com
- Data - Vector stencils library
- Business Process Elements: Data | Workflow Diagram Data | Types ...
- Data Flow Diagrams | Types of Flowchart - Overview | Business ...
- Example of DFD for Online Store ( Data Flow Diagram). DFD ...
- Data Flow Diagrams
- ConceptDraw Solution Park | Entity-Relationship Diagram (ERD ...
- Data Flow Diagrams | Visio Files and ConceptDraw | Process ...
- Interior Design Office Layout Plan Design Element | Design ...
- Order process - BPMN 2.0 diagram | Taxi service order procedure ...
- Group Collaboration Software | How To Successfully Hold a Group ...
- Flow chart Example. Warehouse Flowchart | Workflow Process ...
- Map Infographic Design | Spatial infographics Design Elements ...
- Data flow diagram (DFD) template | Process flow diagram (PFD ...
- ConceptDraw Solution Park | One formula of professional mind ...
- Flowchart - Product life cycle process | Flowchart - Project ...
- Design elements - Data Flow Diagram (DFD) | How to Create ...