 Energy Industry Infographics
Energy Industry Infographics solution is ideal for designing energy-related business infographics, diagrams, charts, illustrations for documents and presentations. It provides a set of libraries with special vector energy industry symbols, icons for electrical power industry, nuclear power industry, fossil fuel industry, and renewable energy industry, energy icons of fuel gas, liquid fuel, solid fuel, industry icons of electrical substations, power plants. Collection of samples including nuclear fuel cycle and energy distribution schematics, electrical substation diagram, energy intelligence dashboard, electricity grid schematics, and many more is also included. This solution is indispensable for all engineers, chefs, managers, marketers, and other professionals working in energy industry.
 Stakeholder Onion Diagrams
The Stakeholder Onion Diagrams solution supplies ConceptDraw DIAGRAM with powerful tools to simplify the process of creating Stakeholder Onion Diagrams. It includes the set of pre-made vector objects and templates for a quick start, and collection of examples illustrating the solution's power. This solution is useful for all specialists in management and business, especially for those who prefer to use the newest progressive tools.
 Oil and Gas
The Oil and Gas solution for ConceptDraw DIAGRAM software provides vector libraries of oil and gas symbols and a collection of samples for quick and simple designing of the oil and gas industry infographics, illustrations, presentations, diagrams. The resulting oil and gas graphics and illustrations help to clearly and quickly detail complex information. They are ideal for reporting on the development of best practices in oil and gas exploration and production. Use them to illustrate growth strategies and trends in the oil industry, conduct analysis, forecast the energy industry, and present the results of international energy forums.
 Critical Infrastructure Sectors
Critical Infrastructure Sectors solution for ConceptDraw DIAGRAM software provides a set of examples and vector stencil libraries for designing infographics and diagrams about means for the most efficient protection of critical infrastructure, energy sector, and rapid recovery in the case of disruptions. Illustrate your projects on the prevention of physical, environmental, and cyber threats, development of information technology and detection equipment. Improve your projects in communications, financial services, emergency services, homeland security, cybersecurity to solve critical issues efficiently and decrease the detrimental effects of disruptions on society and citizens. Show the results of testing new technologies and newest equipment for critical infrastructure protection and increasing resilience.
 Cross-Functional Flowcharts
The Cross-Functional Flowcharts solution extends ConceptDraw DIAGRAM software with cross functional flowchart examples, samples, and libraries of cross functional flow chart vector design elements and CH-1 symbols for easy drawing professional-looking and illustrative Cross Functional Flowchart, Cross Functional Diagram, CH-1 Diagram, Process Flowchart, Deployment Flowchart, Opportunity Flowchart, Swimlane Process Mapping Diagram, or Visio Cross Functional Flowchart for planning and further analyzing, optimizing and improvement processes. The use of included pre-made cross functional flowchart template, opportunity flowchart template, and swimlane process map template, greatly easier designing your Cross-functional flowcharts.
 Divided Bar Diagrams
Divided Bar Diagrams Solution extends the capabilities of ConceptDraw DIAGRAM with templates, samples, and a library of vector stencils for drawing high impact and professional Divided Bar Diagrams and Graphs, Bar Diagram Math, and Stacked Graph. Divided Bar Diagram library objects include a legend that describes categories and can be shown or hidden, moved into a diagram; some objects also include a table of input values for categories. Enter your data in the table, and the segments will be displayed on the chart in accordance with the table data; when you make changes, the chart changes automatically.
 Scatter Diagrams
The Scatter Diagrams solution extends ConceptDraw DIAGRAM functionality with templates, samples, and a library of vector stencils that make construction of a Scatter Plot easy. The Scatter Chart Solution makes it easy to design attractive Scatter Diagrams used in various fields of science, work, and life activities. ConceptDraw DIAGRAM lets you enter the data to the table and construct the Scatter Plot Graph automatically according to these data.
 Pie Charts
Pie Charts are extensively used in statistics and business for explaining data and work results, in mass media for comparison (i.e. to visualize the percentage for the parts of one total), and in many other fields. The Pie Charts solution for ConceptDraw DIAGRAM offers powerful drawing tools, varied templates, samples, and a library of vector stencils for simple construction and design of Pie Charts, Donut Chart, and Pie Graph Worksheets.
 Economy Infographics
The Economy Infographics solution provides a large collection of vector icon libraries, drawing samples and infographic examples for quick and simple design of the best infographics, illustrations, and presentations about economics, markets, economic policy, business, finances, government and social institutions, production, distribution, and consumption of goods and services, economic diagrams and schemes, economic activities designs, continent and country economic maps, economic presentations, market economy and economic system infographic charts, illustrations in economic articles, reports in mass media, and blog posts in social media. It is a valuable tool for wide range of economists, politicians, managers, marketing experts, business analysts, journalists and bloggers focusing on economy, educators and students studying economics, and many other people to communicate visually the economic information.
 Circular Arrows Diagrams
Circular Arrows Diagrams solution extends ConceptDraw DIAGRAM with extensive drawing tools, predesigned samples, Circular flow diagram template for quick start, and a library of ready circular arrow vector stencils for drawing Circular Arrow Diagrams, Segmented Cycle Diagrams, and Circular Flow Diagrams. The elements in this solution help managers, analysts, business advisers, marketing experts, scientists, lecturers, and other knowledge workers in their daily work.
 Scrum Workflow
The Scrum Workflow Solution extends the capabilities of ConceptDraw DIAGRAM with a large collection of professionally-designed samples and a selection of ready-to-use scrum design elements: scrum diagrams and arrows, scrum icons of people, artifacts, workflow, workspace and other colorful scrum clipart, and also scrum charts.
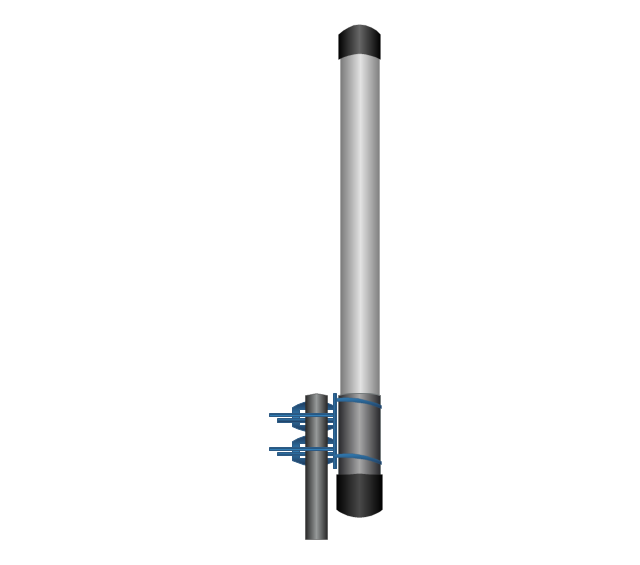
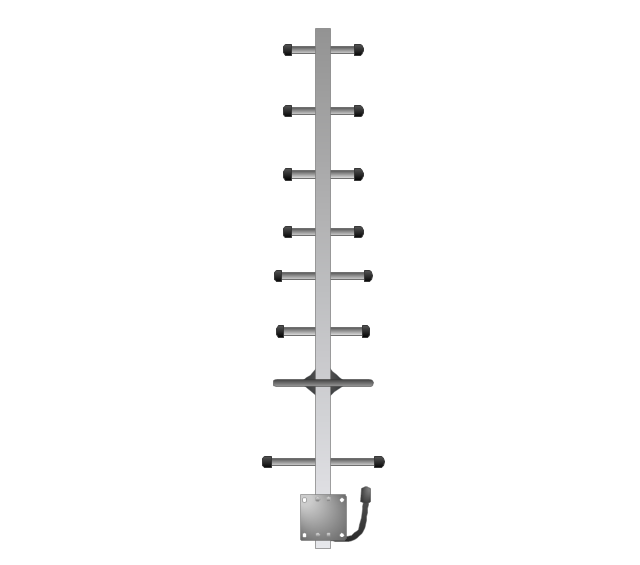
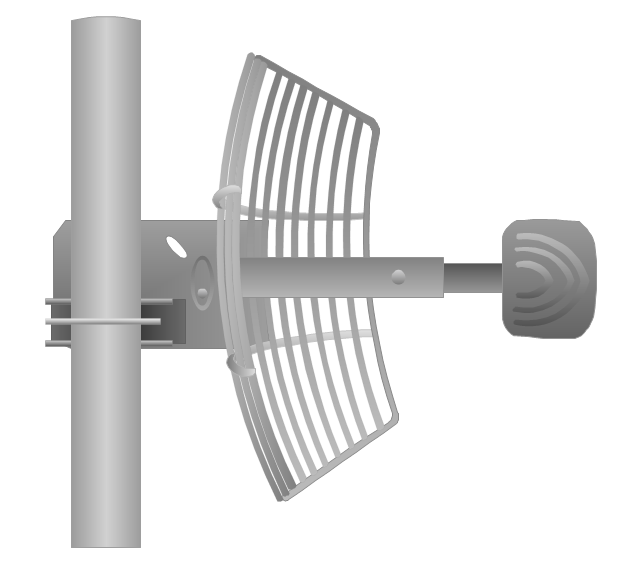
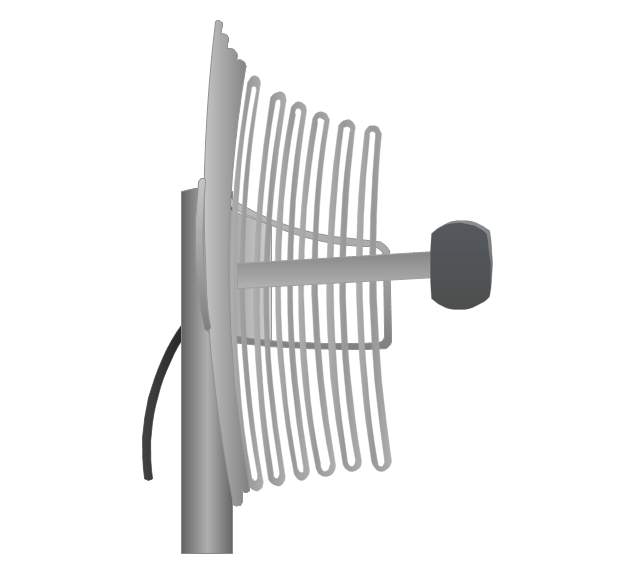
The vector stencils library "Telecom equipment" contains 11 hardware clipart icons of telecommunication devices for drawing computer network diagrams and equipment layouts.
"In telecommunication, a communications system is a collection of individual communications networks, transmission systems, relay stations, tributary stations, and data terminal equipment (DTE) usually capable of interconnection and interoperation to form an integrated whole. The components of a communications system serve a common purpose, are technically compatible, use common procedures, respond to controls, and operate in union. Telecommunications is a method of communication." [Communications system. Wikipedia]
"A basic telecommunication system consists of three primary units that are always present in some form: (1) A transmitter that takes information and converts it to a signal. (2) A transmission medium, also called the "physical channel" that carries the signal. ... (3) A receiver that takes the signal from the channel and converts it back into usable information." [Telecommunication. Wikipedia]
The clip art example "Telecom equipment - Vector stencils library" was created using the ConceptDraw PRO diagramming and vector drawing software extended with the Telecommunication Network Diagrams solution from the Computer and Networks area of ConceptDraw Solution Park.
Andrew multiband high / low power splitter

Andrew multi-band indoor omnidirectional antenna

Panel sector directional antenna

Omni directional antenna
Yagi directional antenna
Yagi integrated downconverter

Grid antenna
Loop antenna
FireTide HotPort® 6000 wireless mesh nodes
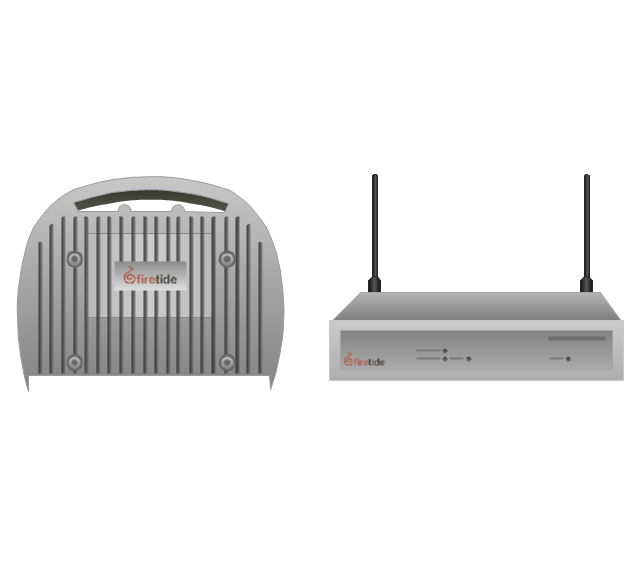
FireTide HotPoint® wireless access point
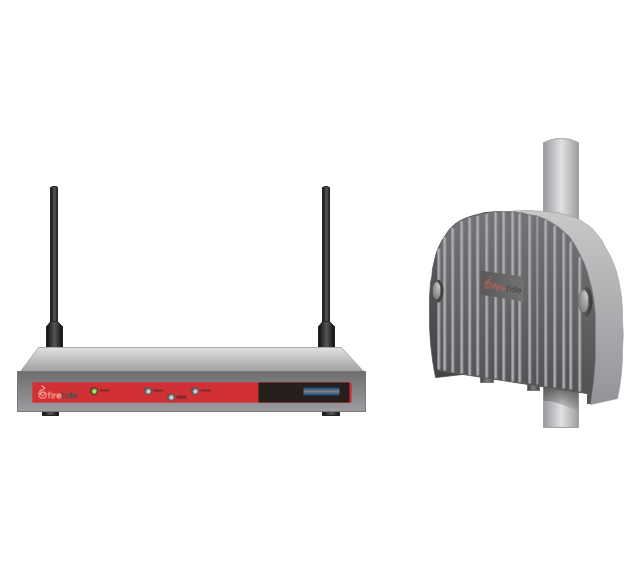
FireTide HotClient Customer Premises Equipment (CPE)
-telecom-equipment---vector-stencils-library.png--diagram-flowchart-example.png)
 Enterprise Architecture Diagrams
Enterprise Architecture Diagrams solution extends ConceptDraw DIAGRAM software with templates, samples and library of vector stencils for drawing the diagrams of enterprise architecture models.
 Basic Circular Arrows Diagrams
Basic Circular Arrows Diagrams solution extends ConceptDraw DIAGRAM with predesigned samples and a library of vector stencils allowing one to create the Circular Arrows diagrams for any purpose or need. Start with one desired of ready-made vector stencils or samples, use it as a circular flow diagram template and make the Circular Arrow Diagram with the required quantity of sectors in a few minutes. Finally, customize your diagram, make stylish changes using the contrasting colors for different steps or identical for some of them, to highlight the most important steps, so designing a diagram the best fitting your taste.
 ConceptDraw Solution Park
ConceptDraw Solution Park collects graphic extensions, examples and learning materials
 Public Utilities
Public Utilities solution is a thematic toolset for designing infographics and diagrams about public utilities. It provides examples and premade public utility icons in vector icons libraries to develop innovative strategies for the improvement of public utility services, enhance their efficiency of delivery, and extend reliable access to services to all communities. The solution helps to public utility companies plan their activities efficiently, develop new technologies and make visual presentation, create plumbing plan, heating plan, electrical diagram, or any other technical drawing, make the overview of modern public utilities, increase utility profits, and remain the best in the market.
 HR Flowcharts
The HR Flowcharts solution is ideal for using while creating the HR-related drawings in the ConceptDraw DIAGRAM charting and drawing software, providing with a comprehensive collection of human resources themed icons, connectors, and images from the available stencil libraries, helping illustrating flowcharts, infographics and workflow diagrams.
 Internet of Things
The Internet of Things solution extends ConceptDraw DIAGRAM with a set of samples and a wide collection of predesigned special clipart, pictograms, and symbols of IoT sensors, IoT devices, smart appliances, retail, industrial, and agricultural IoT devices, and many other IoT objects. This solution is incredibly helpful for designing the Internet of Things (IoT) and Web of Things (WoT) diagrams and infographics of different complexity for numerous areas and industries. It is incredibly useful for engineers, designers, electricians, mechanics, developers, technicians, electronics, and safety-related specialists.
 Travel Infographics
Travel Infographics solution greatly extends the ConceptDraw DIAGRAM functionality making it the best travel infographics design software. Being intended for all specialists in the travel sphere, travel agents, marketers, advertisers, PR specialists, travelers and all other people related with tourism and rest, it contains professionally-designed samples, travel infographics template, and libraries with large variety of ready-made travel infographic vector clipart, design objects and travel infographics icons for drawing exceptional travel infographics and business travel infographics, travel illustrations, presentations, diagrams, schematics, plans, maps, posters, billboards, advertising, marketing, and other materials on the subject of travel and tourism, outdoor activities and extreme sports.
- Electrical Symbols — Electrical Circuits | Sector Antennas For Visio
- How To Create an MS Visio Telecommunication Network Diagram ...
- Telecom - Vector stencils library | Antena Visio
- Seating Plans | Plumbing and Piping Plans | Floor Plans | Chair Visio
- Telecom equipment - Vector stencils library | Stencil Visio Antenas
- Telecom equipment - Vector stencils library | Omni Antenna Visio
- Process Flowchart | Block diagram - Branding strategies | Telecom ...
- Telecommunication Network Diagrams | Wimax Sector Antenna ...
- Electrical circuits - Vector stencils library | Telecom equipment ...