Collaboration in a Project Team

Soccer (Football) Tactics
 Tactics")
HelpDesk
How to Create a Concept Map in ConceptDraw PRO

How To Conduct Effective Team Briefings


 Crystal Mapping
With Crystal Mapping all goals and relevant information can be observed in one radiant dashboard.
Genomics

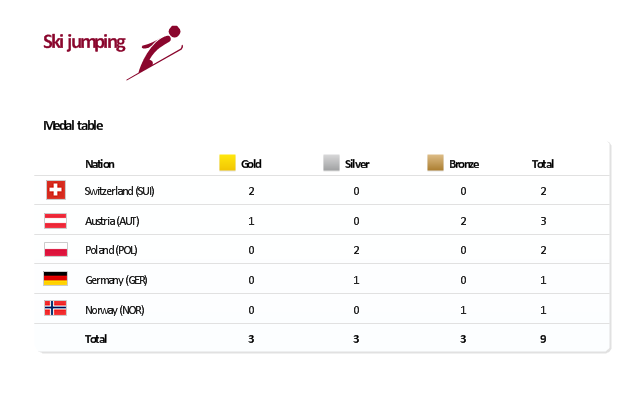
"The ski jumping competition of the Vancouver 2010 Olympics was held at Whistler Olympic Park between 12 and 22 February 2010. ...
For the three events, there are a maximum 70 athletes allowed to compete. No nation can have more than five skiers. For each event, a nation can enter four skiers in individual event or one team in the team event.
Host nation Canada is expected to enter skiers in all events. If no skier meets the qualification standards, they can enter one skier per event.
Quota allocation per nation is based on the World Ranking List (WRL) consisting of Ski Jumping World Cup and Grand Prix points, followed by Continental Cup Standings from the 2008-09 and 2009-10 Ski Jumping World Cup. This will be made by assigning one quota slot per skier from the top of the standings downwards until the maximum five slots have been reached, including host nation Canada." [Ski jumping at the 2010 Winter Olympics. Wikipedia]
This medal table example "Ski jumping at the 2010 Winter Olympics" is created using the ConceptDraw PRO diagramming and vector drawing software extended with the Winter Sports solution.
The Winter Sports solution from the Sport area of ConceptDraw Solution Park contains the vector stencils library "Winter sports pictograms" and examples of diagrams and infographics.
Medal table
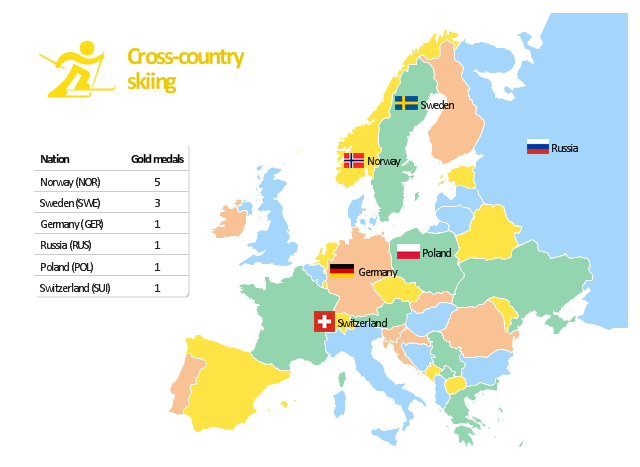
"The cross-country skiing competition of the 2010 Winter Olympics in Vancouver were held at Whistler Olympic Park. The events were held between 15 and 28 February 2010. ...
Across the twelve cross-country skiing events, a maximum of 310 athletes are allowed to compete. No nation can have more than 20 skiers competing, with an additional limit of 12 men or 12 women per specific nation. For each event, a nation can enter four skiers in individual events and one team in relay races." [Cross-country skiing at the 2010 Winter Olympics. Wikipedia]
The Europe map example "Cross-country skiing gold medals - 2010 Winter Olympics" is created using the ConceptDraw PRO diagramming and vector drawing software extended with the Winter Sports solution.
The Winter Sports solution from the Sport area of ConceptDraw Solution Park contains the vector stencils library "Winter sports pictograms" and examples of diagrams and infographics.
Infographics
Process Flowchart


HelpDesk
How to Upgrade ConceptDraw Office vv2-3

Concept Map

Basic Flowchart Symbols and Meaning


SWOT Analysis

HelpDesk
How to Input Data from MS Excel Into a Mind Map

- Individual Task Symbol In Project Management
- PM Easy | ConceptDraw Solution Park | Swot Analysis Of An Individual
- Winter Sports. Using Olympic Games Clipart to Illustrate Tournament ...
- How to Create an Individual Resource Calendar | Calendars | Blank ...
- Winter Olympics - Curling | Winter Olympics - Biathlon | Winter ...
- Blank Calendar Template | Business calendar example | How to ...
- Nordic combined - Winter sports pictograms | Winter sports ...
- Winter Sports | Winter Olympics - Ski jumping | Winter Olympics ...
- Soccer (Football) Formation | Design elements - Football positions ...
- Winter Sports. Olympic Games Illustrations. Medal Summary | Winter ...
- How to Create an Individual Resource Calendar | How to Determine ...
- Individual Swot Analysis Diagram
- Individual Swot Analysis Template
- Winter Sports Vector Clipart. Medal Map. Spatial Infographics ...
- Winter Sports Vector Clipart. Medal Map. Spatial Infographics ...
- Soccer (Football) Positions | Soccer (Football) Formation | Design ...
- Winter Olympics - Snowboarding | Winter Sports | Winter Olympics ...
- American Football Positions Numbers
- Ski jumping - Winter sports pictograms | Winter Olympics - Ski ...