Made with
ConceptDraw
MINDMAP 16

Genomics

Collaboration

Being successful in business is about meeting your defined objectives and adapting to changes occurring in the global market. The ability for an organization to successful adapt to a rapidly changing environment leads to continued growth and success. Failure to adapt, leads to stakeholder disappointment and eventually to extinction if an organization cannot adjust to the situation.

Many organizations, who at one time in their history flourished, have been known to flounder because of loss of direction and vision. Keeping an organization moving forward requires strong collaborative team work to transition an organization from one stage to the next in its life cycle. Mistakes in strategy or implementation today are punishing when your team fails to correctly identify an early opportunity. Early opportunities not acted on cease to be success possibilities.

eLearning for Skype

Note: solution requires ConceptDraw MINDMAP or later.

This solution extends ConceptDraw MINDMAP with the ability to prepare and run remote learning via Skype.

It lets you create educational materials and present remotely to students using Skype conference call.

It works great with other ConceptDraw Solution Park solutions such as Word Exchange, Presentation Exchange, and Mind Map Exchange.

Genetic engineering is moving in a rapid fashion. There are new discoveries occurring at an incredibly fast pace.

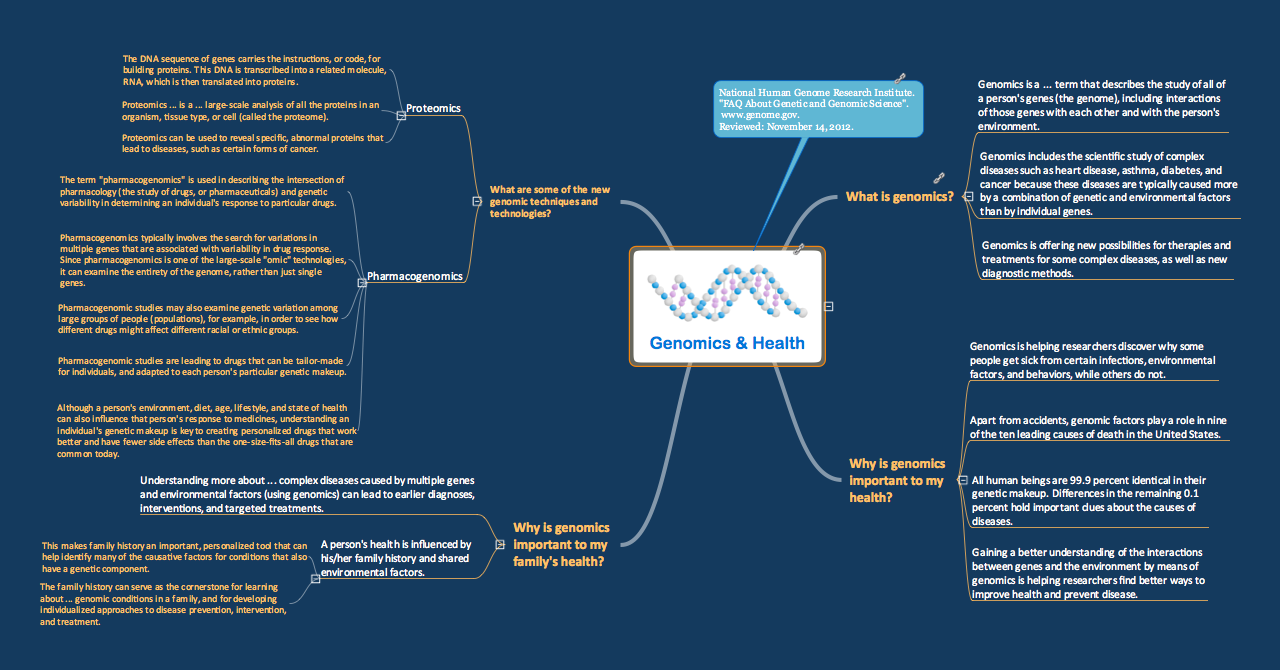
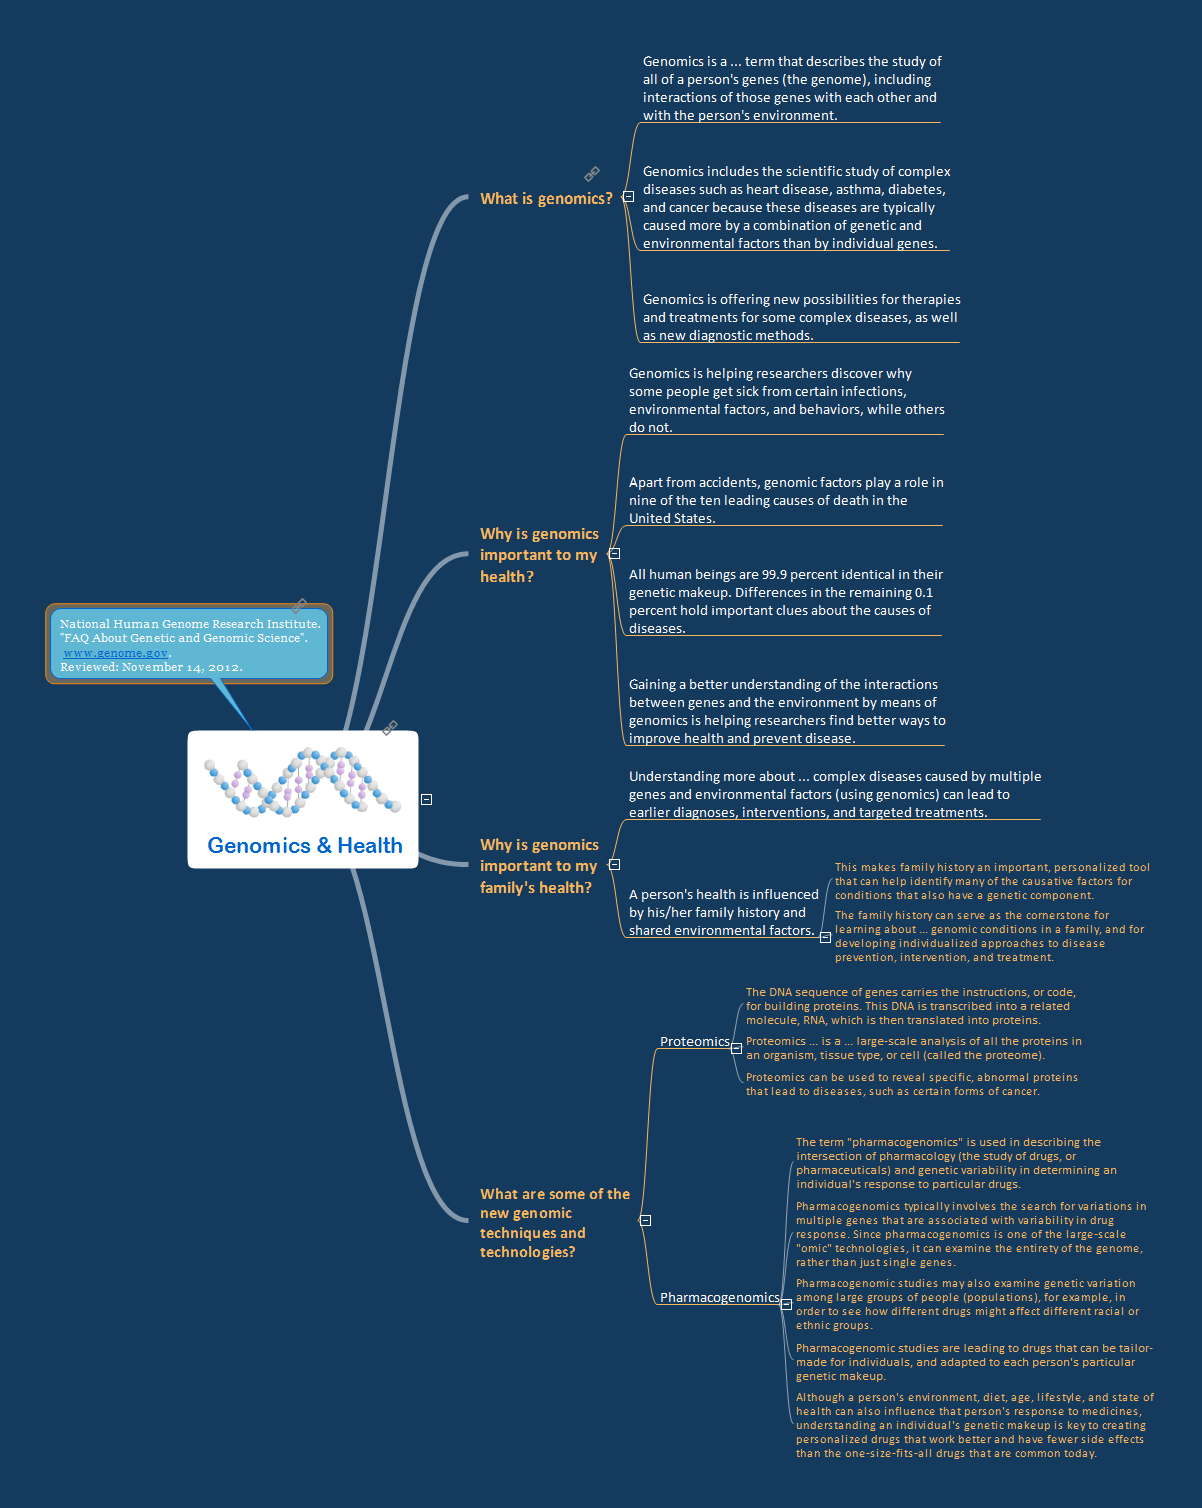
This map was created from content found at "FAQ About Genetic and Genomic Science" (National Human Genome Research Institute, www.genome.gov) and shows how simple in is to use a map structure to explain complex subjects. The content from this map and maps similar to this can be used with the eLearning for Skype solution for ConceptDraw MINDMAP to present complex information in a simplified manner.

Genomics *

Example 1. Genomics


Export to Outline


Genomics & Health
    • What is genomics?
      • Genomics is a ... term that describes the study of all of a person's genes (the genome), including interactions of those genes with each other and with the person's environment.
      • Genomics includes the scientific study of complex diseases such as heart disease, asthma, diabetes, and cancer because these diseases are typically caused more by a combination of genetic and environmental factors than by individual genes.
      • Genomics is offering new possibilities for therapies and treatments for some complex diseases, as well as new diagnostic methods.
    • Why is genomics important to my health?
      • Genomics is helping researchers discover why some people get sick from certain infections, environmental factors, and behaviors, while others do not.
      • Apart from accidents, genomic factors play a role in nine of the ten leading causes of death in the United States.
      • All human beings are 99.9 percent identical in their genetic makeup. Differences in the remaining 0.1 percent hold important clues about the causes of diseases.
      • Gaining a better understanding of the interactions between genes and the environment by means of genomics is helping researchers find better ways to improve health and prevent disease.
    • Why is genomics important to my family's health?
      • Understanding more about ... complex diseases caused by multiple genes and environmental factors (using genomics) can lead to earlier diagnoses, interventions, and targeted treatments.
      • A person's health is influenced by his/her family history and shared environmental factors.
        • This makes family history an important, personalized tool that can help identify many of the causative factors for conditions that also have a genetic component.
        • The family history can serve as the cornerstone for learning about ... genomic conditions in a family, and for developing individualized approaches to disease prevention, intervention, and treatment.
    • What are some of the new genomic techniques and technologies?
      • Proteomics
        • The DNA sequence of genes carries the instructions, or code, for building proteins. This DNA is transcribed into a related molecule, RNA, which is then translated into proteins.
        • Proteomics ... is a ... large-scale analysis of all the proteins in an organism, tissue type, or cell (called the proteome).
        • Proteomics can be used to reveal specific, abnormal proteins that lead to diseases, such as certain forms of cancer.
      • Pharmacogenomics
        • The term "pharmacogenomics" is used in describing the intersection of pharmacology (the study of drugs, or pharmaceuticals) and genetic variability in determining an individual's response to particular drugs.
        • Pharmacogenomics typically involves the search for variations in multiple genes that are associated with variability in drug response. Since pharmacogenomics is one of the large-scale "omic" technologies, it can examine the entirety of the genome, rather than just single genes.
        • Pharmacogenomic studies may also examine genetic variation among large groups of people (populations), for example, in order to see how different drugs might affect different racial or ethnic groups.
        • Pharmacogenomic studies are leading to drugs that can be tailor-made for individuals, and adapted to each person's particular genetic makeup.
        • Although a person's environment, diet, age, lifestyle, and state of health can also influence that person's response to medicines, understanding an individual's genetic makeup is key to creating personalized drugs that work better and have fewer side effects than the one-size-fits-all drugs that are common today.

The Benefits for ConceptDraw MINDMAP Brainstorming Software

  • ConceptDraw MINDMAP is effective for brainstorming, designing mind maps, idea generating, creative and lateral thinking, creativity and problem solving.
  • ConceptDraw MINDMAP is ideal for team and personal work in Business, Marketing and Project Management.
  • The libraries with large quantity of vector objects help to illustrate your mind maps and to make them bright, visual and comprehensible.
  • Use of View Navigator tool lets create presentations from a mind map: you can simply select the map parts you want to present, sequence your slides, and preview the presentation.
  • ConceptDraw MINDMAP provides wide capabilities of importing and exporting in various formats: Microsoft PowerPoint, Microsoft Word, MS Excel, Mindjet MindManager, image, HTML, PDF file.


NINE RELATED HOW TO's:
E-Learning in Schools: Online Language Teaching tools. E-Learning software for remote presentations with Skype. Best practices for eLearning.Language School E-Learning *
Picture: Language School E-Learning
Related Solution:
While creating flowcharts and process flow diagrams, you should use special objects to define different statements, so anyone aware of flowcharts can get your scheme right. There is a short and an extended list of basic flowchart symbols and their meaning. Basic flowchart symbols include terminator objects, rectangles for describing steps of a process, diamonds representing appearing conditions and questions and parallelograms to show incoming data. This diagram gives a general review of the standard symbols that are used when creating flowcharts and process flow diagrams. The practice of using a set of standard flowchart symbols was admitted in order to make flowcharts and other process flow diagrams created by any person properly understandable by other people. The flowchart symbols depict different kinds of actions and phases in a process. The sequence of the actions, and the relationships between them are shown by special lines and arrows. There are a large number of flowchart symbols. Which of them can be used in the particular diagram depends on its type. For instance, some symbols used in data flow diagrams usually are not used in the process flowcharts. Business process system use exactly these flowchart symbols.Basic Flowchart Symbols Meaning
Picture: Flowchart Symbols: Meaning and Examples
Related Solution:
Is it possible to draw a diagram as quickly as the ideas come to you? The innovative ConceptDraw Arrows10 Technology included in ConceptDraw DIAGRAM is a simple and powerful tool to create any type of diagram. You mau choose to start from one of plenty diagram templates or to use your own idea.How To Draw a Diagram *
Picture: How To Draw a Diagram
ConceptDraw MindMap benefits comparing to Mindjet Mindmanager: Economical. (Lower license price, support is no charge maintenance is an optional one-time fee that delivers to you the next major release) ConceptDraw products are structured to save you money from the date of purchase for the life of the product. When you compare ConceptDraw MINDMAP to Mindjet Mindmanager the cost savings will be obvious. Flexible Licensing. ConceptDraw is licensed per-named-user. Want ConceptDraw on 2 PCs, 2 Macs, or a PC and a Mac? Straightforward licensing makes this easy.Looking at ConceptDraw MINDMAP as a Replacement <br>for Mindjet Mindmanager *
Picture: Looking at ConceptDraw MINDMAP as a Replacement for Mindjet Mindmanager
Related Solutions:
When trying to figure out the nature of the problems occurring within a project, there are many ways to develop such understanding. One of the most common ways to document processes for further improvement is to draw a process flowchart, which depicts the activities of the process arranged in sequential order — this is business process management. ConceptDraw DIAGRAM is business process mapping software with impressive range of productivity features for business process management and classic project management. This business process management software is helpful for many purposes from different payment processes, or manufacturing processes to chemical processes. Business process mapping flowcharts helps clarify the actual workflow of different people engaged in the same process. This samples were made with ConceptDraw DIAGRAM — business process mapping software for flowcharting and used as classic visio alternative because its briefly named "visio for mac" and for windows, this sort of software named the business process management tools. This flowchart diagram shows a process flow of project management. The diagram that is presented here depicts the project life cycle that is basic for the most of project management methods. Breaking a project into phases allows to track it in the proper manner. Through separation on phases, the total workflow of a project is divided into some foreseeable components, thus making it easier to follow the project status. A project life cycle commonly includes: initiation, definition, design, development and implementation phases. Distinguished method to show parallel and interdependent processes, as well as project life cycle relationships. A flowchart diagram is often used as visual guide to project. For instance, it used by marketing project management software for visualizing stages of marketing activities or as project management workflow tools. Created with ConceptDraw DIAGRAM — business process mapping software which is flowcharting visio alternative or shortly its visio for mac, this sort of software platform often named the business process management tools.Process Flowchart
Picture: Process Flowchart: A Step-by-Step Comprehensive Guide
Related Solution:
eLearning Solutions: Free Platform for Remote Learning. Skype as a remote education tool. Digital Learning Technologies.Skype as eLearning Platform *
Picture: Skype as eLearning Platform
Related Solution:
This sample was created in ConceptDraw DIAGRAM software using the Flowcharts solution.Copying Service Process Flowchart. Flowchart Examples
Picture:
Copying Service Process Flowchart.
Flowchart Examples
Related Solution:
Download ConceptDraw diagram software for easy drawing.The Best Choice for Creating Diagram *
Picture: The Best Choice for Creating Diagram
Related Solution:
If your company is in chaos in clutter and no one understands their rights and responsibilities, maybe it's time to change that. One of the ways to put the company in order is to draw an organization chart that would reflect the structure and show the relationships among departments and positions. This is a very useful and easy to understand scheme. This is example of the one of the most typical kind of organizational chart. It depicts an organizational structure of the hierarchical type. Its construction is similarv to pyramid. The single main position on the top - in this case, the mayor's position followed by sub-levels of authority in his command. Each position in the pyramid reports only to his supervisor, and takes only a report of direct subordinates. Such scheme limits the number of communications. This organizational structure is effectively used in public organizations. Also it is suitable for any organization with the need for multiple levels of middle managers. The ability to create organizational charts of different types is supplied with ConceptDraw Ogrcharts solutions.How to Draw an Organization Chart *
Picture: How to Draw an Organizational Chart
Related Solution:
ConceptDraw
MINDMAP 16