Winter Sports. Olympic Games Infographics. Medal Table

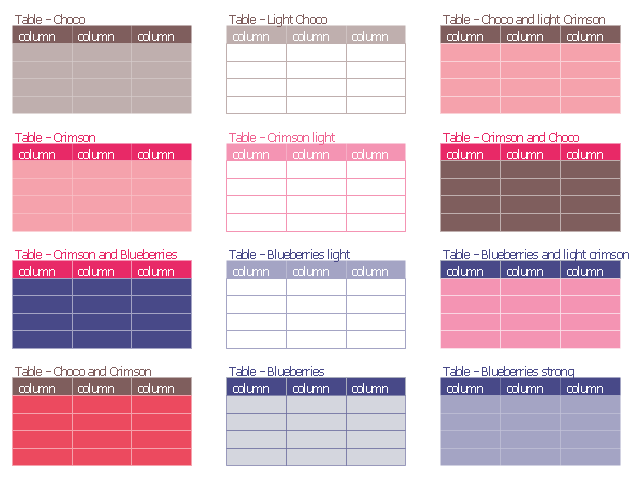
The vector stencils library "Tables" contains 12 table blocks. Use it to add typography elements into your infographics.
"A table is a means of arranging data in rows and columns. The use of tables is pervasive throughout all communication, research and data analysis. Tables appear in print media, handwritten notes, computer software, architectural ornamentation, traffic signs and many other places. The precise conventions and terminology for describing tables varies depending on the context. Further, tables differ significantly in variety, structure, flexibility, notation, representation and use. In books and technical articles, tables are typically presented apart from the main text in numbered and captioned floating blocks." [Table (information). Wikipedia]
The example "Design elements - Tables" was created using the ConceptDraw PRO diagramming and vector drawing software extended with the Typography Infographics solition from the area "What is infographics" in ConceptDraw Solution Park.
Typography infographics elements - Tables
HelpDesk
How to Create a Typography Infographic Using ConceptDraw PRO

Winter Sports Vector Clipart. Medal Map. Spatial Infographics

Infographic Generator

Infographic Tools

HelpDesk
How to Create Management Infographics Using ConceptDraw PRO

Typography Infographic Software

Typography Art

Winter Sports. Using Winter Sports Design Elements Producing Infographics

HelpDesk
How to Create PowerPoint Presentation from Data Driven Infographics Using ConceptDraw PRO

How to draw Metro Map style infographics? (London)

HelpDesk
How to Draw a Pareto Chart Using ConceptDraw PRO

- Winter Sports. Olympic Games Infographics . Medal Table | How to ...
- Winter Sports. Olympic Games Infographics . Medal Table | Design ...
- Tables and figures show - Infographics | Design elements - Tables ...
- Winter Sports. Olympic Games Infographics . Medal Table | Winter ...
- Basic Diagramming | Winter Sports. Olympic Games Infographics ...
- Winter Sports. Olympic Games Infographics . Medal Table ...
- Winter Sports. Olympic Games Infographics . Medal Table | Sport ...
- Tables And Columns Infographics Design
- Flow Chart for Olympic Sports | Winter Sports. Olympic Games ...
- Winter Sports. Illustrations and Visualize Statistics | Information ...
- Winter Sports. Olympic Games Infographics . Medal Table | Spatial ...
- Winter Sports. Olympic Games Infographics . Medal Table | Winter ...
- Winter Sports. Olympic Games Infographics . Medal Table
- Typography Infographic Software | Typography Infographic ...
- Education Infographics | Educational Materials | Information Graphic ...
- Typography Infographic Examples | Excellent Examples of ...
- How to Create Education Infographics | Information Graphic ...
- Winter Sports | Winter Sports. Olympic Games Infographics . Medal ...
- Sport pictograms. Olympic Games | Winter Sports. Olympic Games ...
- Design elements - Tables | Tables ' Beauty | Tables - Vector stencils ...