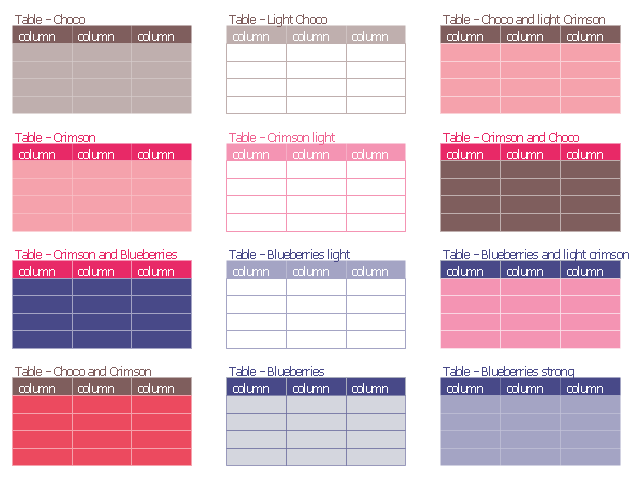
The vector stencils library "Tables" contains 12 table blocks. Use it to add typography elements into your infographics.
"A table is a means of arranging data in rows and columns. The use of tables is pervasive throughout all communication, research and data analysis. Tables appear in print media, handwritten notes, computer software, architectural ornamentation, traffic signs and many other places. The precise conventions and terminology for describing tables varies depending on the context. Further, tables differ significantly in variety, structure, flexibility, notation, representation and use. In books and technical articles, tables are typically presented apart from the main text in numbered and captioned floating blocks." [Table (information). Wikipedia]
The example "Design elements - Tables" was created using the ConceptDraw PRO diagramming and vector drawing software extended with the Typography Infographics solition from the area "What is infographics" in ConceptDraw Solution Park.
Typography infographics elements - Tables
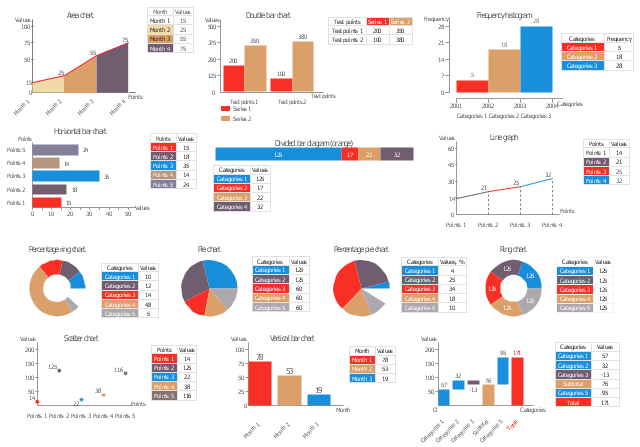
The vector stencils library "Data-driven Charts" contains 13 data-driven charts: pie charts, line graphs, bar charts.
Use it to create your data-driven infographics: drag and drop selected chart from the library into your infographic document, then add your data into hideable table.
The example "Design Elements - Data-driven charts" was created using the ConceptDraw PRO diagramming and vector graphics software extended with the Data-driven Infographics" solution from the area "What is infographics" of ConceptDraw Solution Park.
Pie charts, line graphs, bar charts
HelpDesk
How to Create an ERD Diagram
 using Chen's notation")
Scrum process work items and workflow

 Entity-Relationship Diagram (ERD)
An Entity-Relationship Diagram (ERD) is a visual presentation of entities and relationships. That type of diagrams is often used in the semi-structured or unstructured data in databases and information systems. At first glance ERD is similar to a flowch
Typography Infographic Software

 Website Wireframe
The innovative Website Wireframe solution enhances the ConceptDraw PRO v10 functionality with newest wireframe tools, libraries with variety of predesigned icons, symbols, buttons, graphics, forms, boxes, and many other vector elements, templates and professionally designed samples, which make it the best wireframing software. Website Wireframe solution gives you significant advantages when designing and maintaining websites, creating skeletal and content-free depictions of website structure, making website prototypes and planning the content arrangement before committing to design, also speeds up the processes of sketching, producing and sharing wireframe examples of website style and interface design.
 Cafe and Restaurant Floor Plans
Restaurants and cafes are popular places for recreation, relaxation, and are the scene for many impressions and memories, so their construction and design requires special attention. Restaurants must to be projected and constructed to be comfortable and e
 Status Dashboard
Status dashboard solution extends ConceptDraw PRO software with templates, samples and vector stencils libraries with graphic indicators for drawing the visual dashboards showing status data.
HelpDesk
How to Create SWOT Analysis Template Using ConceptDraw PRO

 Floor Plans
Construction, repair and remodeling of the home, flat, office, or any other building or premise begins with the development of detailed building plan and floor plans. Correct and quick visualization of the building ideas is important for further construction of any building.
 Seating Plans
The correct and convenient arrangement of tables, chairs and other furniture in auditoriums, theaters, cinemas, banquet halls, restaurants, and many other premises and buildings which accommodate large quantity of people, has great value and in many cases requires drawing detailed plans. The Seating Plans Solution is specially developed for their easy construction.
- Table Design Infographics
- Winter Sports. Olympic Games Infographics . Medal Table | Design ...
- Winter Sports. Olympic Games Infographics . Medal Table ...
- Design elements - Tables | Tables ' Beauty | Tables - Vector stencils ...
- Winter Sports. Olympic Games Infographics . Medal Table | How to ...
- Design elements - Tables | Table Seating Chart Template | Symbol ...
- Design elements - Tables | SWOT and TOWS Matrix Diagrams ...
- Winter Sports. Olympic Games Infographics . Medal Table | Design ...
- How to Design a Food-related Infographics Using ConceptDraw ...
- Design elements
- Bar Chart Software | Design elements - Bar charts | Column Chart ...
- Design elements - Periodic table of chemical elements | Chemistry ...
- Flowchart design . Flowchart symbols, shapes, stencils and icons ...
- Winter Sports. Olympic Games Infographics . Medal Table | How to ...
- Typography Infographic Software | Typography Infographic ...
- Data-driven charts - Vector stencils library | Design Elements - Data ...
- Data Infographics | Infographic Tools | Design Elements - Data ...
- Winter Sports. Olympic Games Infographics . Medal Table | Winter ...
- Geo Map - Africa - Rwanda | Infographic software: the sample of ...
- Design elements - Periodic table of chemical elements | Periodic ...