Infographic Tools
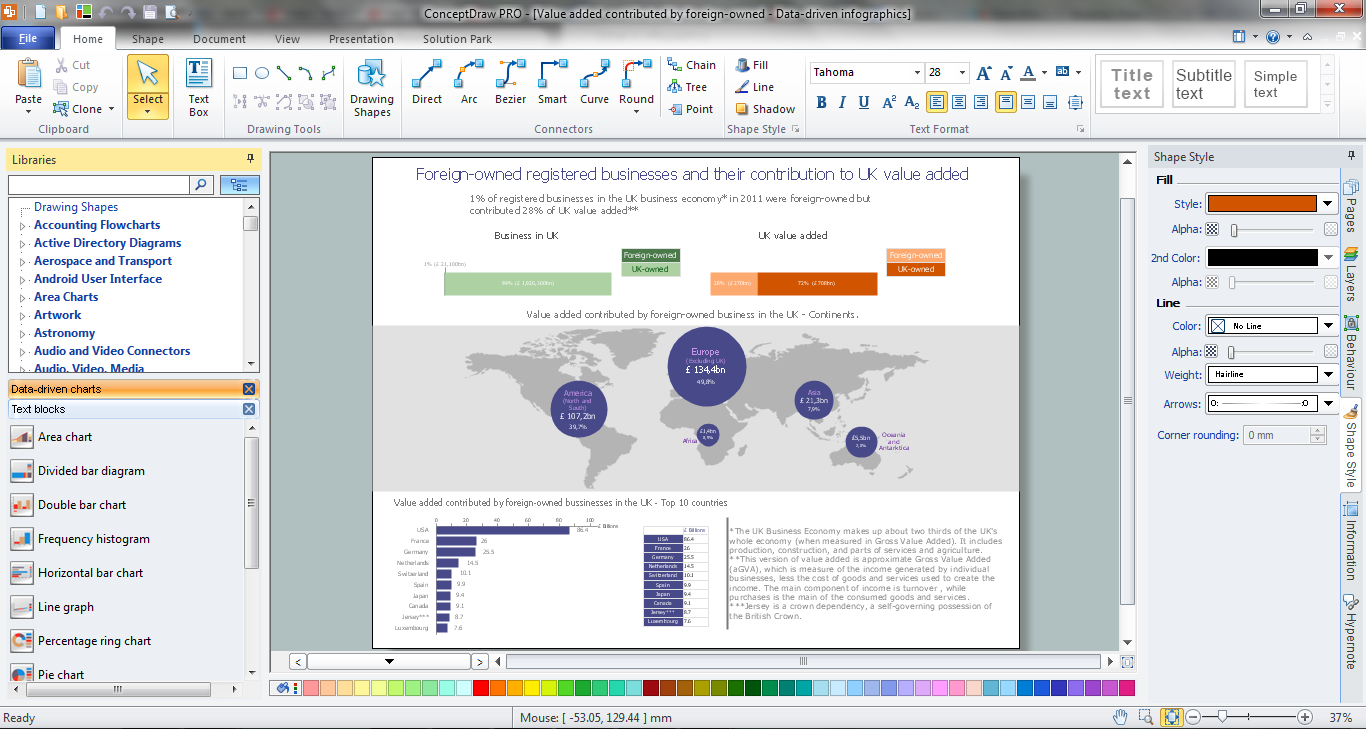
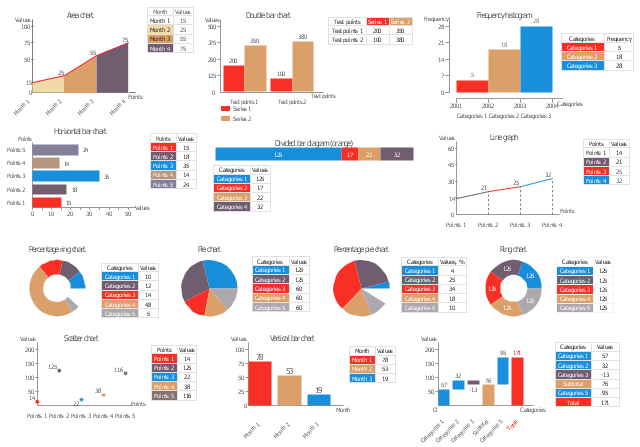
The vector stencils library "Data-driven Charts" contains 13 data-driven charts: pie charts, line graphs, bar charts.
Use it to create your data-driven infographics: drag and drop selected chart from the library into your infographic document, then add your data into hideable table.
The example "Design Elements - Data-driven charts" was created using the ConceptDraw PRO diagramming and vector graphics software extended with the Data-driven Infographics" solution from the area "What is infographics" of ConceptDraw Solution Park.
Pie charts, line graphs, bar charts
Data Infographics
HelpDesk
How to Create Data-Driven Infographics

HelpDesk
How to Add Data-driven Infographics to MS Word Document

 IDEF Business Process Diagrams
Use the IDEF Business Process Diagrams solution to create effective database designs and object-oriented designs, following the integration definition methodology.
Data Driven Strategies
 Event-driven Process Chain Diagrams
Event-Driven Process Chain Diagrams solution extends ConceptDraw DIAGRAM functionality with event driven process chain templates, samples of EPC engineering and modeling the business processes, and a vector shape library for drawing the EPC diagrams and EPC flowcharts of any complexity. It is one of EPC IT solutions that assist the marketing experts, business specialists, engineers, educators and researchers in resources planning and improving the business processes using the EPC flowchart or EPC diagram. Use the EPC solutions tools to construct the chain of events and functions, to illustrate the structure of a business process control flow, to describe people and tasks for execution the business processes, to identify the inefficient businesses processes and measures required to make them efficient.
Best Tool for Infographic Construction

- Data - driven charts - Vector stencils library | How to Add Data - driven ...
- Tools to Create Your Own Infographics | Design Elements - Data ...
- How to Create Data - driven Infographics | How to Add Data - driven ...
- How to Add Data - driven Infographics to a MS Word Document Using ...
- Pie Charts Design
- Design Pictorial Infographics. Design Infographics | Transportation ...
- Infographic Software | Marketing Plan Infographic | Typography ...
- How to Create Data - driven Infographics | How to Add Data - driven ...
- How to Create PowerPoint Presentation from Data Driven ...