HelpDesk
How to Make PowerPoint Presentation of Data Driven Infographics

Excellent Examples of Infographic Maps

Transportation Infographics
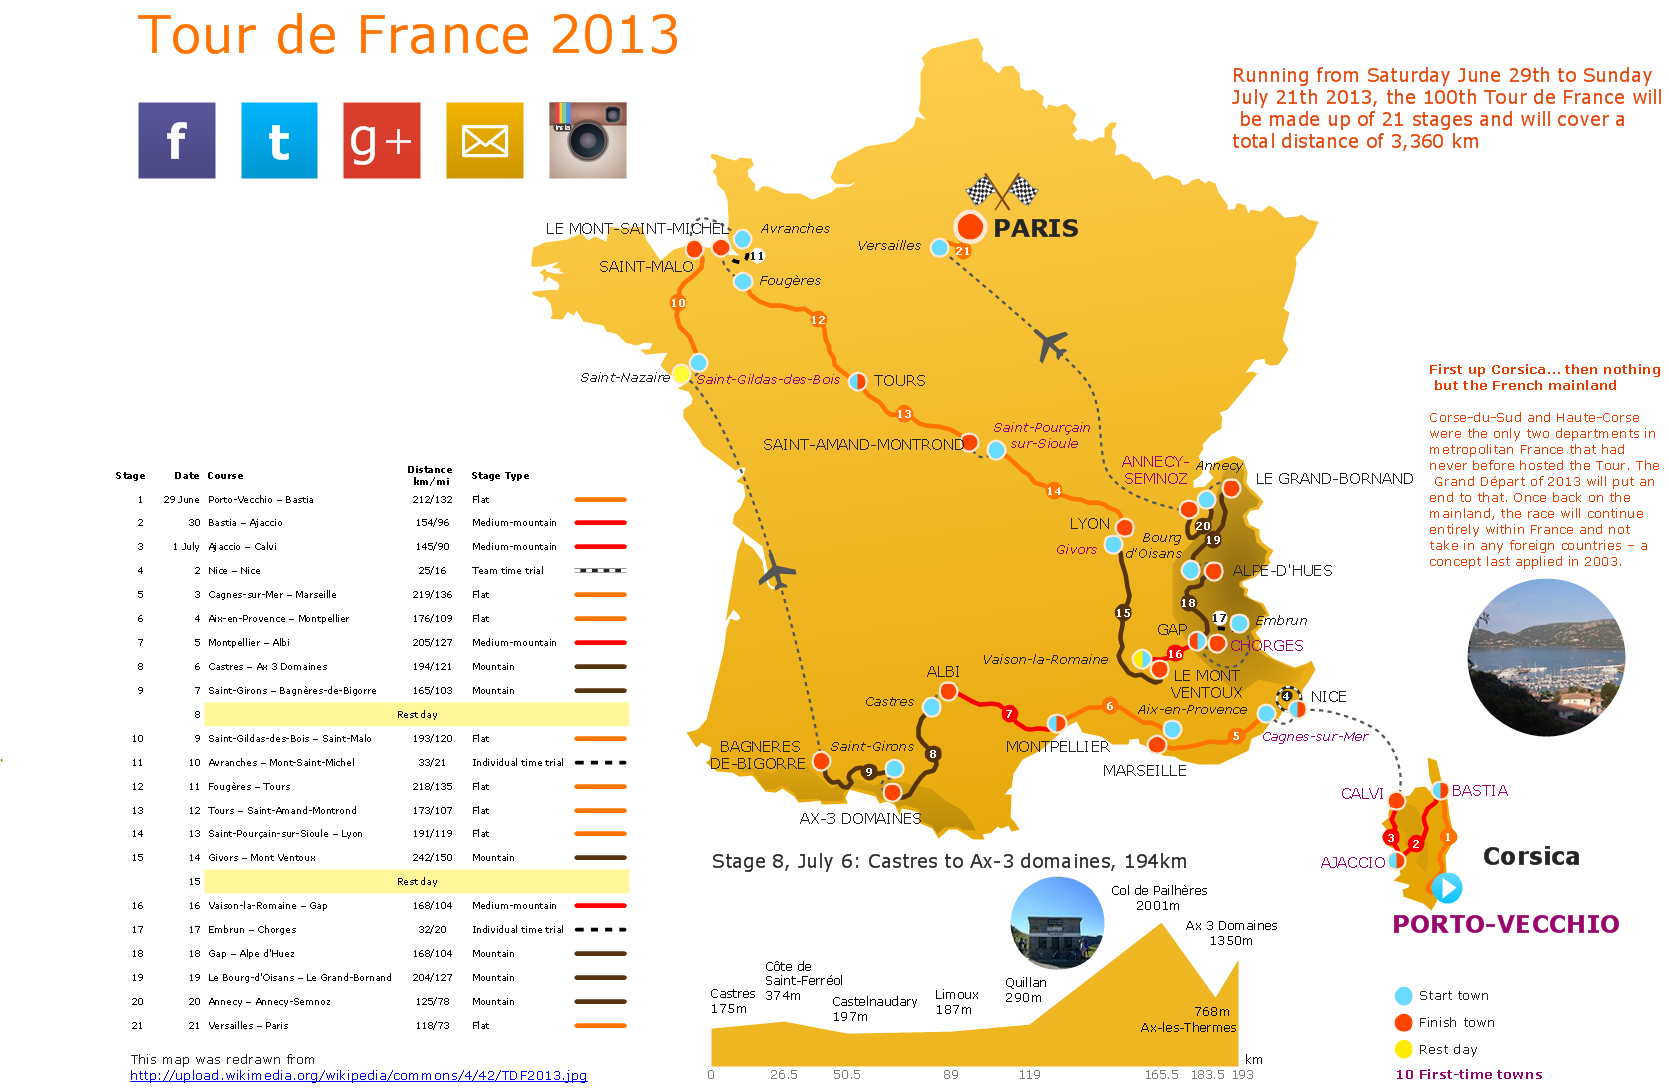
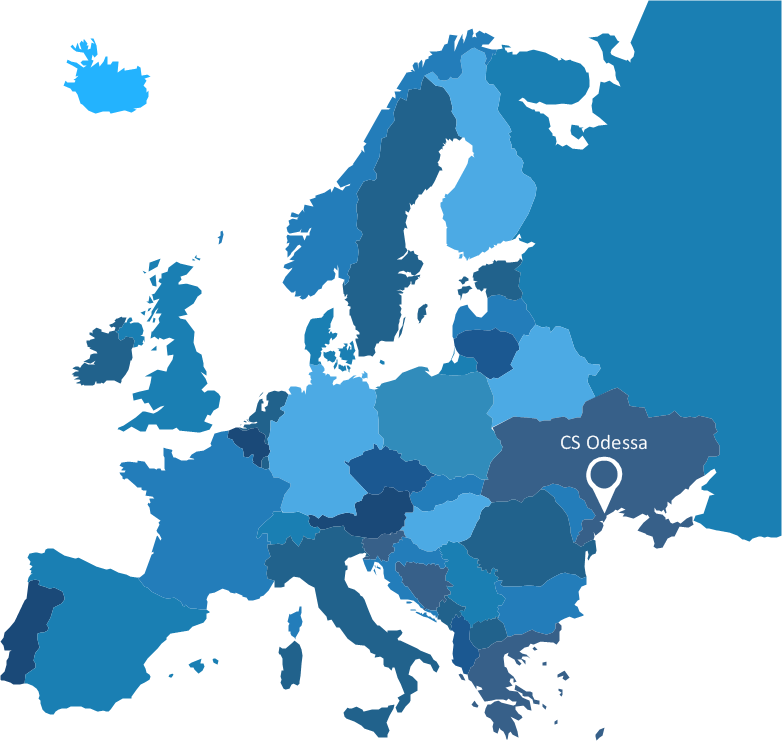
Spatial infographics Design Elements: Continental Map

HelpDesk
How to Create Management Infographics

Map Infographic Creator

HelpDesk
How to Create Data-Driven Infographics

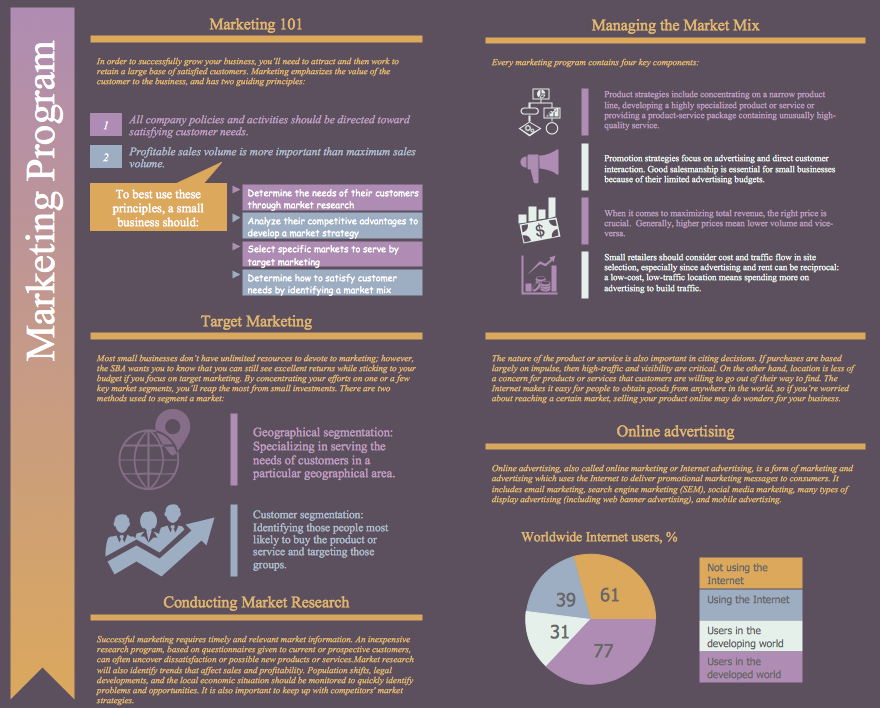
Marketing Plan Infographic
Best Tool for Infographic Construction

Visualization Spatial Data Using Thematic Maps Combined with Infographics
- London Tube Map Ppt Template
- Template Powerpoint Plan De Métro
- Free Powerpoint Infographics
- SWOT analysis matrix diagram templates | SWOT analysis Software ...
- Metro Line Template Ppt
- Metro Map | Subway Map Powerpoint Template
- Strategy Ppt Template Free
- Powerpoint Timeline Generator
- Aerospace Powerpoint Template