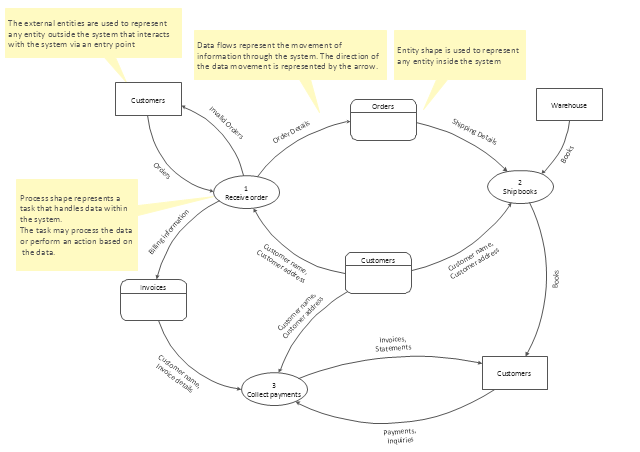
Data Flow Diagrams (DFD) visualize data flows in information systems.
They show: what kinds of data input to and output from the system; where the data come from and go to; where the data is stored.
DFDs are used for design and analysis of business and engineering information systems.
They are also used for data processing visualization.
They show: what kinds of data input to and output from the system; where the data come from and go to; where the data is stored.
DFDs are used for design and analysis of business and engineering information systems.
They are also used for data processing visualization.
DFD template
 Data Flow Diagrams (DFD)
Data Flow Diagrams solution extends ConceptDraw PRO software with templates, samples and libraries of vector stencils for drawing the data flow diagrams (DFD).
 Universal Diagramming Area
This area collects solutions for drawing diagrams, charts, graphs, matrices, geographic and road maps for education, science, engineering, business.
Control and Information Architecture Diagrams (CIAD) with ConceptDraw PRO

ConceptDraw PRO DFD Software

Garrett IA Diagrams with ConceptDraw PRO

LLNL Flow Charts
.jpg "LLNL flow charts")
Data modeling with ConceptDraw PRO

IDEF9 Standard

Data structure diagram with ConceptDraw PRO

- Structured Systems Analysis and Design Method (SSADM) with ...
- Structured Systems Analysis and Design Method (SSADM) with ...
- Data Flow Diagrams
- How to Create Flowcharts for an Accounting Information System ...
- Data Flow Diagrams
- Data Flow Diagrams
- Data Flow Diagrams with ConceptDraw PRO | Interactive Voice ...
- Data Flow Diagrams with ConceptDraw PRO
- Data flow diagram template
- Data Flow Diagrams
- Data Flow Diagrams
- Data Flow Diagrams | ConceptDraw PRO The best Business ...
- Data Flow Diagrams
- Data Flow Diagrams | ConceptDraw PRO DFD Software
- Flowcharts | Cross-Functional Process Map Template | Data Flow ...
- Data Flow Diagrams | Business diagrams & Org Charts with ...
- Data Flow Diagrams
- ConceptDraw PRO DFD Software | Data flow diagram (DFD ...
- Data Flow Diagrams
- Data Flow Diagrams