Basic Flowchart Symbols and Meaning


Value-Stream Mapping for Manufacturing
")
Bar Diagrams for Problem Solving. Create manufacturing and economics bar charts with Bar Graphs Solution

Process Flowchart


Value Stream Mapping Symbols

Graphical Symbols to use in EPC diagrams
")
HelpDesk
How to Create Flowchart Using Standard Flowchart Symbols

Value Stream Management

How to Build Cloud Computing Diagram Principal Cloud Manufacturing

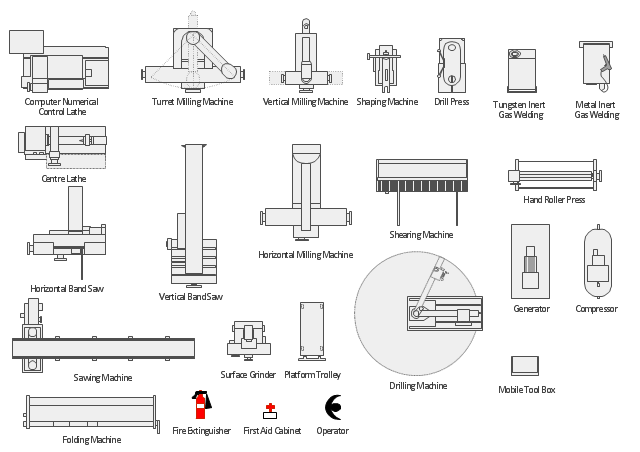
The vector stencils library "Machines and equipment" contains 24 symbols of industrial machines and equipment.
Use the design elements library "Machines and equipment" for drawing plant interior design plans, manufacturing equipment layouts and factory floor plans using the ConceptDraw PRO diagramming and vector drawing software.
"Manufacturing is the production of goods for use or sale using labor and machines, tools, chemical and biological processing, or formulation. The term may refer to a range of human activity, from handicraft to high tech, but is most commonly applied to industrial production, in which raw materials are transformed into finished goods on a large scale.
Modern manufacturing includes all intermediate processes required for the production and integration of a product's components. Some industries, such as semiconductor and steel manufacturers use the term fabrication instead.
The manufacturing sector is closely connected with engineering and industrial design." [Manufacturing. Wikipedia]
The shapes library "Machines and equipment" is included in the Plant Layout Plans solution from the Building Plans area of ConceptDraw Solution Park.
Machines and equipment symbols
Cross Functional Flowchart Examples

Basic Flowchart Images. Flowchart Examples

What is Value Stream Mapping?

Value Stream Mapping Template

- Geometric Characteristics Symbols Of Manufacturing Processes
- Manufacturing Drawing Symbols
- Basic Flowchart Symbols and Meaning | Process Flowchart | Types ...
- Welding Symbol For Manufacturing Drawing
- Flowchart Symbol In Manufacturing
- Mechanical Symbols In Manufacturing
- Manufacturing Process Flow Diagram Symbols
- Basic Flowchart Symbols and Meaning | Process Flowchart | Value ...
- Symbol Of Manufacturing Processes
- Flowchart Symbols In Manufacturing
- Basic Flowchart Symbols and Meaning | Process Flowchart | Cross ...
- Process Flowchart | Basic Flowchart Symbols and Meaning | Types ...
- Manufacturing Block Diagrams
- Machine Manufacturing Processes Symbols
- Manufacturing Machining Symbols Dreaing
- Process Flowchart | Basic Flowchart Symbols and Meaning | Cross ...
- Process Flowchart | Basic Flowchart Symbols and Meaning | Lean ...
- Manufacturing and Maintenance | Electrical Symbols ...
- Manufacturing Company Flow Chart Symbol
- Basic Flowchart Symbols and Meaning | Process Flowchart | Types ...