Entity-Relationship Diagram (ERD) with ConceptDraw DIAGRAM


Process Flow Chart Symbols

"Microsoft Management Console is a component of Windows 2000 and its successors that provides system administrators and advanced users an interface for configuring and monitoring the system.
Snap-ins and consoles.
The management console can host Component Object Model components called snap-ins. Most of Microsoft's administration tools are implemented as MMC snap-ins. Third parties can also implement their own snap-ins using the MMC's application programming interfaces published on the Microsoft Developer Network's web site." [Microsoft Management Console. Wikipedia]
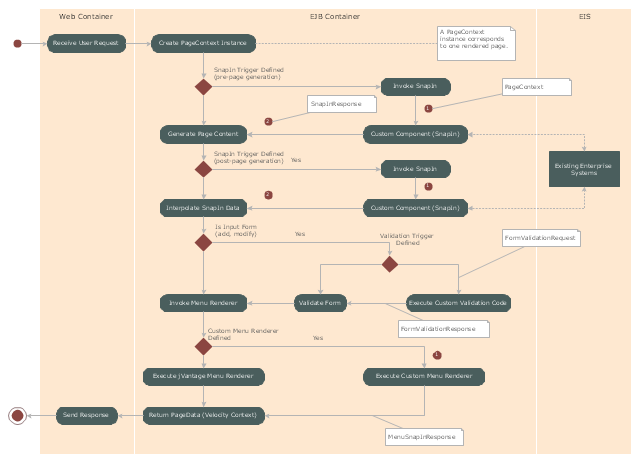
The UML activity diagram example "Snap in process" was created using the ConceptDraw PRO diagramming and vector drawing software extended with the Rapid UML solution from the Software Development area of ConceptDraw Solution Park.
Snap-ins and consoles.
The management console can host Component Object Model components called snap-ins. Most of Microsoft's administration tools are implemented as MMC snap-ins. Third parties can also implement their own snap-ins using the MMC's application programming interfaces published on the Microsoft Developer Network's web site." [Microsoft Management Console. Wikipedia]
The UML activity diagram example "Snap in process" was created using the ConceptDraw PRO diagramming and vector drawing software extended with the Rapid UML solution from the Software Development area of ConceptDraw Solution Park.
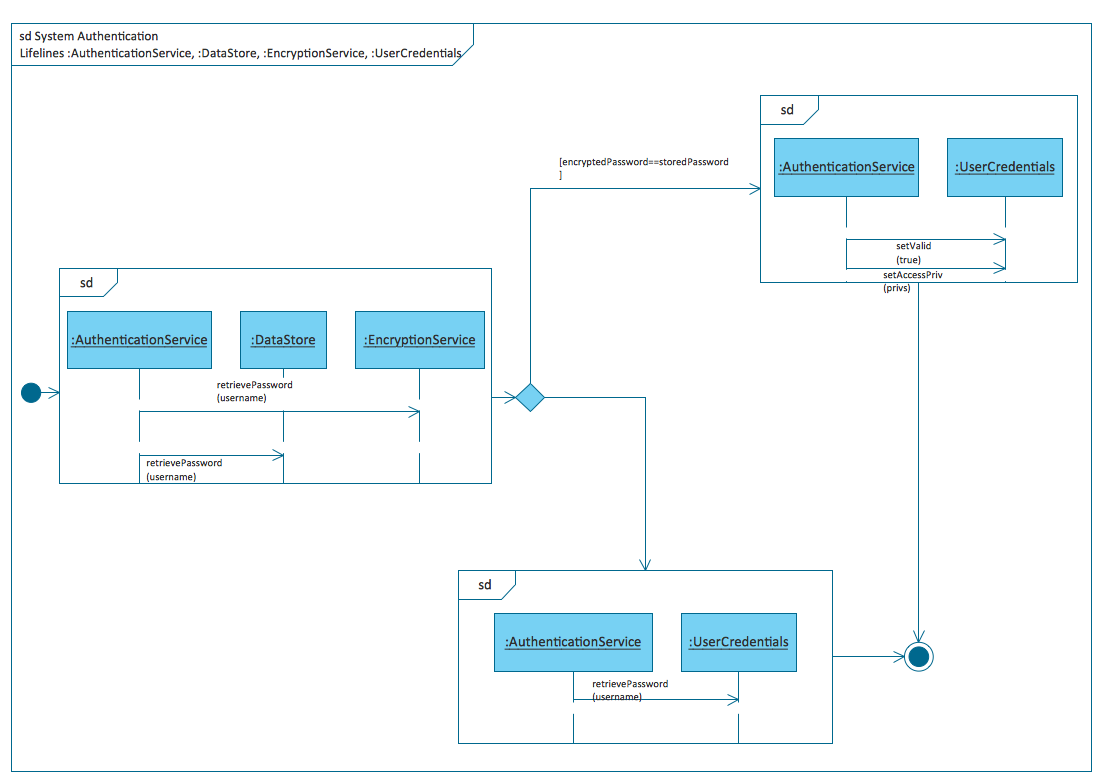
UML activity diagram
ConceptDraw DIAGRAM : Able to Leap Tall Buildings in a Single Bound

Business Diagram Software


In searching of alternative to MS Visio for MAC and PC with ConceptDraw DIAGRAM

Introductory Guide to Rapid UML Solution
Sample Project Flowchart. Flowchart Examples


Value stream with ConceptDraw DIAGRAM

Collaboration in a Project Team

Product Overview
Total Quality Management with ConceptDraw

- Cross-Functional Flowchart (Swim Lanes) | Swim Lane Flowchart ...
- Swim Lane Diagrams | Swim Lanes Flowchart. Flowchart Examples ...
- Activity Swimlane Diagram Example
- Swim Lane Diagrams | Cross-Functional Flowchart (Swim Lanes ...
- UML activity diagram ( swimlanes ) - Template | Swim Lane Flowchart ...
- Swimlanes In Activity Diagram Example
- UML Activity Diagram | Diagramming Software for Design UML ...
- UML activity diagram ( swimlanes ) - Template | Cross-Functional ...
- UML activity diagram ( swimlanes ) - Template | Business Process ...
- UML activity diagram ( swimlanes ) - Template | Design elements ...
- UML activity diagram ( swimlanes ) - Template
- Order process - BPMN 2.0 diagram | Process Flowchart | Business ...
- Payroll process - Swim lane process mapping diagram | Swim lane ...
- UML activity diagram ( swimlanes ) - Template | Design elements ...
- Swimlane Activity Diagram Example
- Activity Diagram Tutorial
- Swimlane Activity Diagram For Login
- Swim Lane Diagrams | UML activity diagram ( swimlanes ) - Template ...
- Booch OOD Diagram | OOSE Method | Examples for OOSE Method ...