Data flow diagrams (DFDs) are effective to reveal relationships among the various components in a program or system. This type of diagrams is an important and useful technique for modeling an information system, its process aspects, for showing a system as a single high-level process. DFD lets illustrate the flow of data, how the input data are transformed to output results across the sequence of functional transformations. DFD consists of four major components: entities, processes, data stores, data flows.
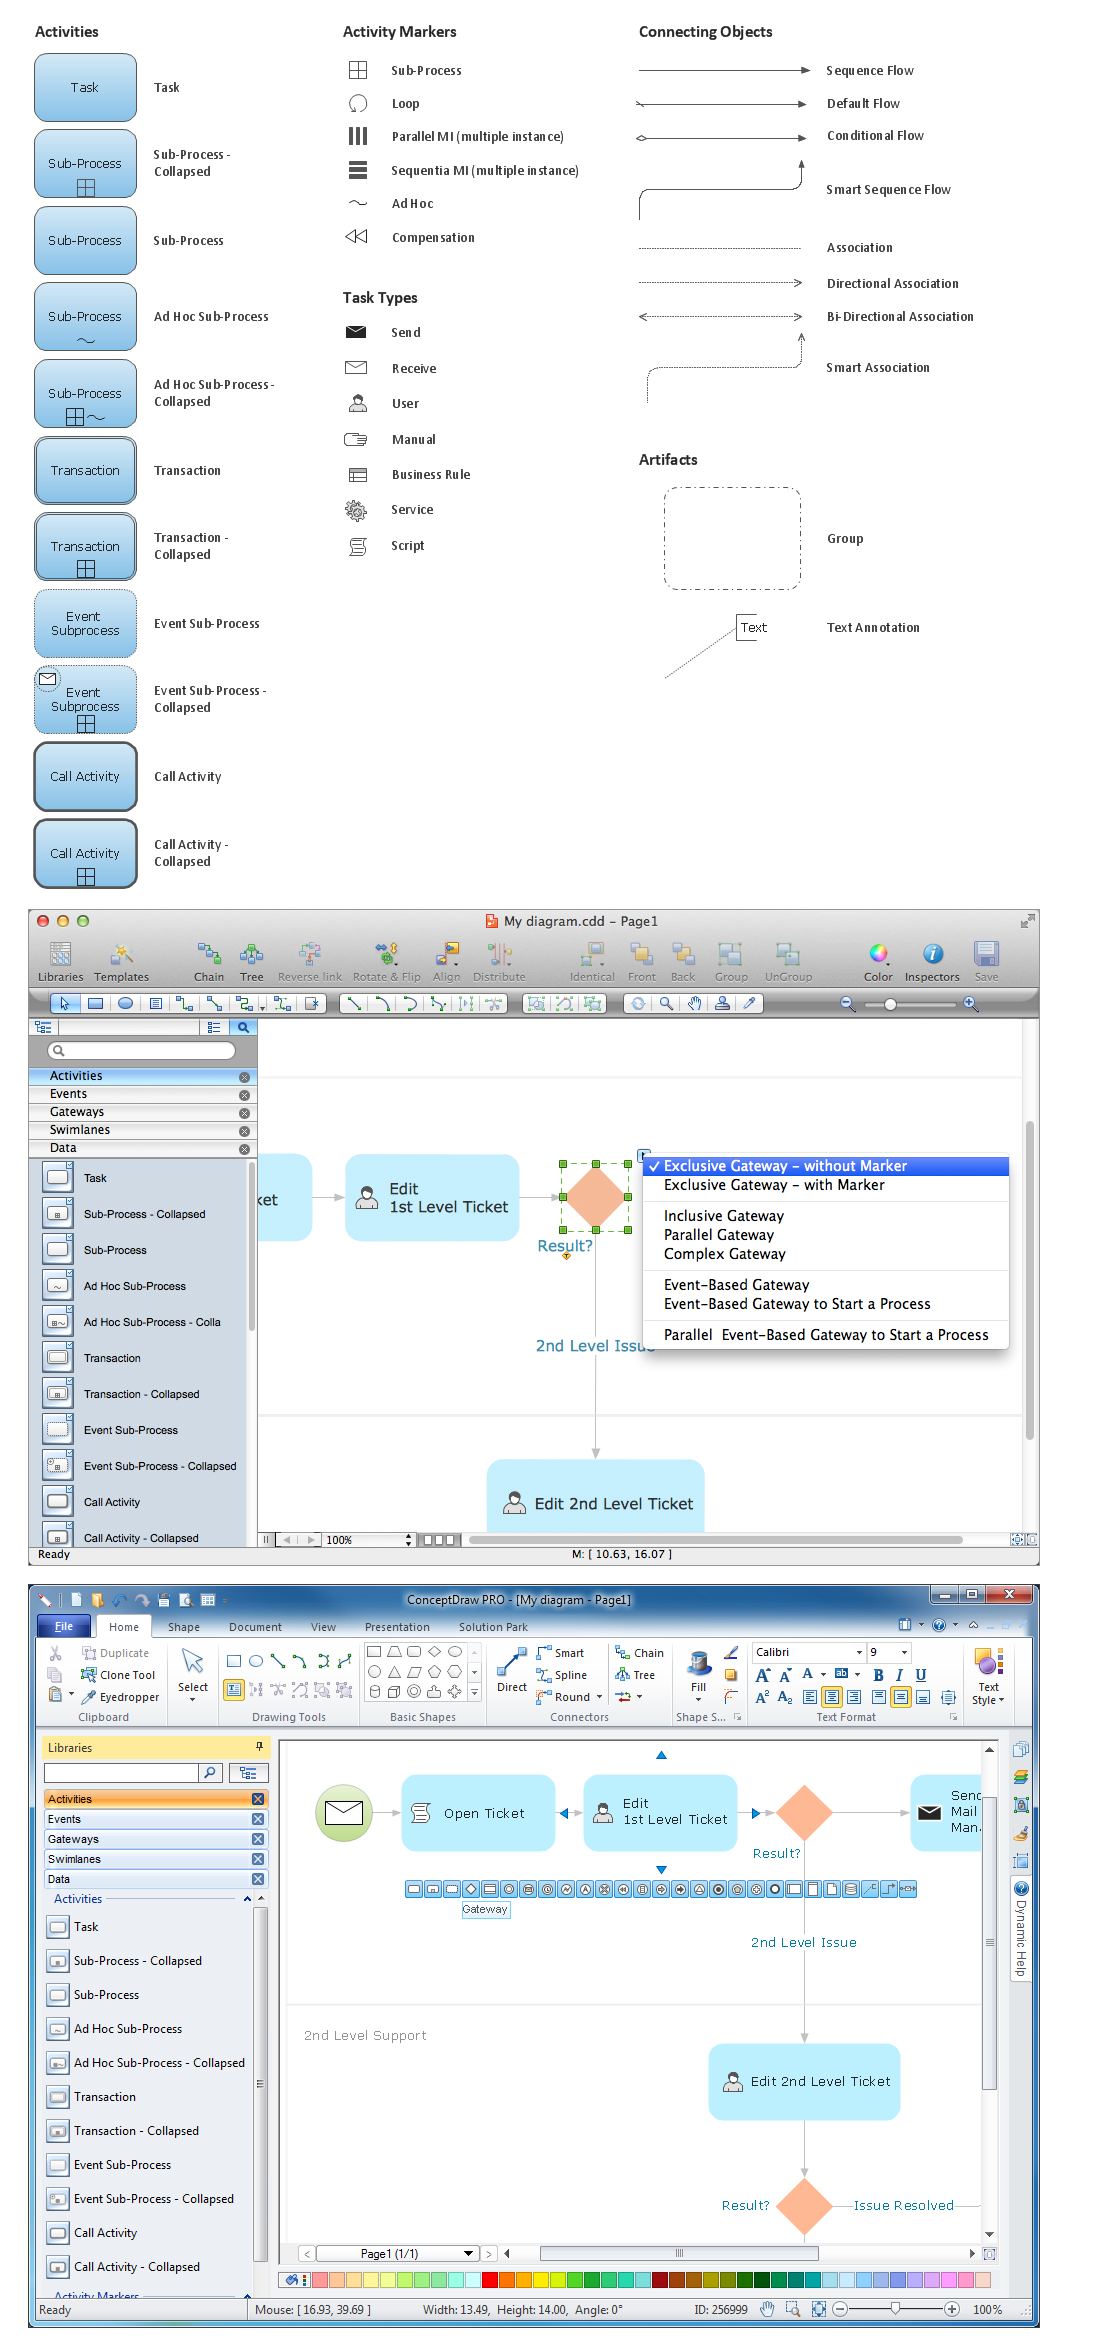
When you need to draw a Data Flow Diagram the ConceptDraw DIAGRAM diagramming and vector drawing software extended with Data Flow Diagrams solution will be helpful for you. Providing numerous collection of Data Flow Diagram examples, samples, templates and ready-to-use vector DFD symbols, Data Flow Diagrams solution ensures you with all needed tools for easy designing DFDs according to Gane-Sarson or Yourdon-Coad notation on your choice. Any from offered predesigned DFD examples can become a perfect base for your own diagram.