This site uses cookies. By continuing to browse the ConceptDraw site you are agreeing to our Use of Site Cookies.

Venn Diagram Examples for Problem Solving. Environmental Social Science. Human Sustainability Confluence

The Venn diagram example below shows sustainable development at the confluence of three constituent parts.
Create your Venn diagrams for problem solving in environmental social science using the ConceptDraw DIAGRAM diagramming and vector drawing software extended with the Venn Diagrams solution from the area "Diagrams" of ConceptDraw Solution Park.

Venn Diagram Examples for Problem Solving

In the Venn Diagrams solution, there are the pre-made examples that can be always used for making the unique, great looking diagrams, such as the 2-set Venn ones of any needed colour, the 3-set one, the 4-set ones and the 5-set ones. Having the already previously created samples of the Venn diagrams can help any ConceptDraw DIAGRAM user make it possible to make the needed drawing within only a few minutes by editing the existing ones.

Venn Diagram Template for Word

This template shows the Venn Diagram. It was created in ConceptDraw DIAGRAM diagramming and vector drawing software using the ready-to-use objects from the Venn Diagrams Solution from the "Diagrams" area of ConceptDraw Solution Park.

Basic Circles Venn Diagram. Venn Diagram Example

Venn Diagrams visualize all possible logical relations between several sets and are widely used in mathematics, logic, statistics, marketing, sociology, etc.
This Venn Diagram shows the relative complement of the set A with respect to the set B. It is the set of the elements in B, but not in A. In other words it is the set-theoretic difference B-A.

Pyramid Diagram

Zooko's triangle is known to be a trilemma which is a concept in international economics which states that it is impossible to have a fixed foreign exchange rate, a free capital movement and an independent monetary policy at the same time.

Business process Flow Chart — Event-Driven Process chain (EPC) diagrams

Event-Driven Process chain Diagrams for improvement throughout an organisation. Best software for Process Flow Diagram. The Event-driven Process Chain (EPC) Diagrams allows managers to plan processes and resources.

Simple Drawing Applications for Mac

ConceptDraw gives the ability to draw simple diagrams like flowcharts, block diagrams, bar charts, histograms, pie charts, divided bar diagrams, line graphs, area charts, scatter plots, circular arrows diagrams, Venn diagrams, bubble diagrams, concept maps, and others.

Basic Audit Flowchart. Flowchart Examples

This sample shows the Audit Process Flowchart. It was created in ConceptDraw DIAGRAM diagramming and vector drawing software using the Flowcharts solution from the Diagrams area of ConceptDraw Solution Park.
The Audit Flowcharts are widely used in the financial management, accounting, money management and in many others fields.

Fishbone Problem Solving

The knowledge and ability to apply various strategies for dealing with problems and difficult situations is very useful in many areas. The Fishbone strategy is one of the most progressive. This graphical technique helps to identify possible causes of problems, to set the goals, and also show internal connections between the different parts of problem. After reviewing all causes and facts, you can easily find right solution.
ConceptDraw DIAGRAM diagramming and vector drawing software extended with Fishbone Diagrams Solution from the Management Area of ConceptDraw Solution Park is a powerful Fishbone Problem Solving tool.

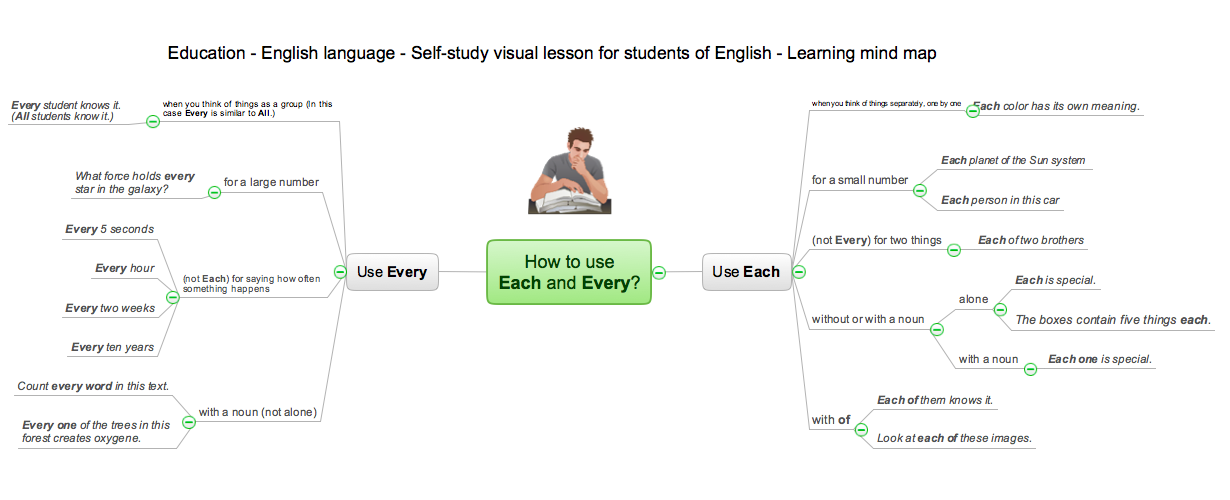
Language School E-Learning

E-Learning in Schools: Online Language Teaching tools. E-Learning software for remote presentations with Skype. Best practices for eLearning.

Scientific Symbols Chart

ConceptDraw DIAGRAM is the beautiful design software that provides many vector stencils, examples and templates for drawing different types of illustrations and diagrams.


Mathematics Solution from the Science and Education area of ConceptDraw Solution Park includes a few shape libraries of plane, solid geometric figures, trigonometrical functions and greek letters to help you create different professional looking mathematic illustrations for science and education.

Business Diagram Software

ConceptDraw business diagram Software is the most powerful business and relational charting software. Create advanced, completely customizable flow charts, organizational charts, business process diagrams, work flow diagrams, audit diagram, value stream maps, TQM diagrams, ERD diagrams, EPC diagrams, marketing diagrams, cause and effect diagrams, dashboards, infographics and other relational business diagrams from your data.
Business Process Modeling

map of england, map of scotland, united kingdom map, uk map, map of uk, great britain map, map of great britain, map of united kingdom, map of wales UK Map

map of england, map of scotland, united kingdom map, uk map, map of uk, great britain map, map of great britain, map of united kingdom, map of wales
The Map of UK solution contains collection of professionally designed samples and scalable vector stencil graphics maps, representing the United Kingdom counties, regions and cities. Use the Map of UK solution from ConceptDraw Solution Park as the base fo

Best Software to Draw Diagrams

ConceptDraw DIAGRAM can help you make professional diagrams quickly.

social media flow chart, social media marketing Social Media Response

social media flow chart, social media marketing
This solution extends ConceptDraw DIAGRAM and ConceptDraw MINDMAP with the ability to draw interactive flow charts with action mind map templates, to help create an effective response to applicable social media mentions.